

Survey on the Access to Finance of Enterprises in the euro area - First quarter of 2025
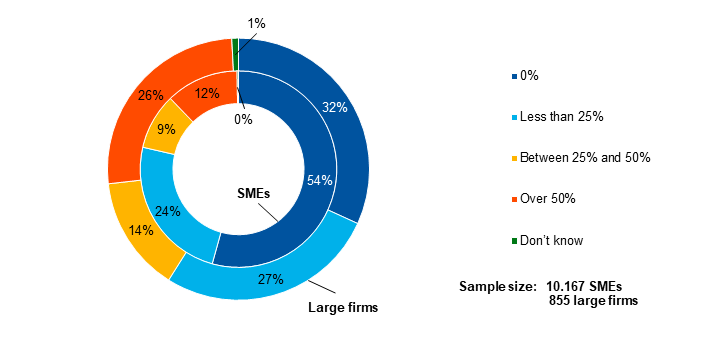
This report presents the main results of the 34th round of the Survey on the Access to Finance of Enterprises (SAFE) in the euro area, which was conducted between 10 February and 21 March 2025. In this survey round, firms were asked about economic and financing developments over two different reference periods. Around half of firms were asked about changes in the period between October 2024 and March 2025. The remainder, all from the 12 largest euro area countries, were asked about changes in the period between January and March 2025. Altogether, the sample comprised 11,022 firms in the euro area, of which 10,167 (92%) had fewer than 250 employees.[1]
Overall, survey results indicate that the monetary policy easing cycle is reducing the interest rates charged to firms. A net 12% of firms reported a decrease in bank interest rates, up from a net 4% in the previous quarter (Chart 1 in Section 2). This quarter saw a marked increase in the net number of large firms reporting a decline in interest rates (‑26%, from ‑7% in the previous round), while interest rates for small and medium-sized enterprises (SMEs) remained relatively stable, with a net 1% reporting a decrease. In net terms, however, firms indicated a further slight tightening of other loan conditions, relating to both price and non-price factors.
Firms reported a small reduction in the need for bank loans, while availability was broadly unchanged (Table 1, columns 2, 6, and 10 at the end of this section and Chart 2 in Section 2). In the first quarter of 2025, a net 4% of firms reported a reduced need for bank loans, while a net 1% reported a decline in the availability of bank loans. As a result, the euro area bank loan financing gap indicator – an index capturing the difference between changes in needs and availability – was broadly unchanged (a net ‑1%, from a net 1% in the previous quarter). Looking ahead, firms expect a modest improvement in the availability of bank financing over the next three months.
Financing from external and internal sources continued to be used primarily for fixed investment and for inventories and working capital (Chart 5). Fixed investment was identified as the most common use of financing, reported by 46% of firms, followed by the replenishment of inventories and working capital, as indicated by 39% of firms. Generally, large firms are more likely to report using external financing for fixed investments, and their usage has increased over the past two years. In contrast, the trend has remained relatively unchanged for SMEs. Similarly, the share of firms securing financing for inventories and working capital has generally been consistent over the same period, indicating no significant supply bottlenecks.
Firms continued to perceive the general economic outlook to be the main factor hampering the availability of external financing (Chart 7 in Section 2). In the first quarter of 2025, a net 21% of firms reported that a deterioration in the general economic outlook had reduced the availability of external financing, from a net 22% in the fourth quarter of 2024. Firms also reported a worsening impact of their firm-specific outlook on financing availability.
Firms continued to report an increase in banks' willingness to lend, although by slightly less than in the previous survey round (Chart 8 in Section 2). On balance, 7% of firms reported an improvement in banks’ willingness to lend, from 8% in the previous survey round. A net 5% of SMEs perceived an improvement in banks’ lending practices, whereas this figure was 11% for large firms.
The share of firms applying for bank loans remained relatively low, mainly due to high levels of internal funds (Chart 9 in Section 2). In the first quarter of 2025, bank loan applications rose to 19%, up 2 percentage points from the previous quarter. The most common reason reported by firms for not applying for a bank loan was the amount of internal funds at their disposal, which firms considered sufficient to finance their business plans.
The percentage of firms reporting obstacles to obtaining a bank loan remained low and had declined slightly. Among firms that considered bank loans relevant for their firm, 5% faced obstacles when seeking to obtain a loan, from 6% in the previous quarter (Table 1, columns 11 and 12 in this section, and Chart 10 in Section 2).
As monetary policy easing transmits to firms, an estimated indicator of firms’ financing conditions shows less tightening compared with the previous quarter and the past six months (Chart A, panels a) and b) in this section). The indicator reflects firms’ perceptions of price terms and conditions of financing, including changes in bank interest rates and other bank-related costs such as charges, fees and commissions. It is one of three “principal components” capturing how euro area firms view overall financing conditions.[2] During this survey period, the indicator continued its sharp decline from the peak in 2023, reaching levels similar to those seen in 2019. This rapid decline highlights the ongoing reduction in interest rates, despite firms’ perception of an increase by banks in other borrowing costs. A comparison across firm sizes shows that large firms began to experience an easing of financing conditions, while SMEs continued to report tightening conditions.
Chart A
Change in price terms and conditions as perceived by euro area firms
a) Six months |
b) Three months |
|---|---|
(weighted scores) |
(weighted scores) |
 |
 |
Base: Firms that applied for a bank loan.
Notes: Indicator derived from factor analysis. For details of the analysis see footnote 2. In panel a), the indicator is based on firm-level survey replies from 2019 to the first quarter of 2025, using the replies on changes in the previous six months, and in panel b), the indicator is based on replies on the changes in the previous three months (as from the first survey round for which quarterly replies have been available)The aggregate indicators are the average of firm-level scores, weighted by size, economic activity and country. Positive values indicate a deterioration in firms’ financing conditions. The individual scores have a range of between -100 and 100.
Over the last three months, on balance, few firms reported an increase in turnover, but expectations for the next quarter have risen. A net 6% of euro area firms indicated higher turnover in the first quarter of 2025, unchanged from the previous quarter (Chart 11 in Section 3). Large firms reported a significant improvement in turnover, while SMEs indicated a decline. Firms, and more especially large firms, are, however, very optimistic about expected turnover in the second quarter of 2025.
Slightly more firms continued to signal a deterioration in profits. A net 16% of firms reported a decline in profits in the first quarter of 2025, compared with a net 14% in the fourth quarter of 2024. The decline was more widespread among SMEs than large firms.
Over the past three months, the share of financially vulnerable firms was low and similar to the previous quarter (Chart 12 in Section 3). Only 4% of firms experienced significant difficulties in managing their businesses and servicing their debts during this period.
Few firms reported an increase in investment in the last three months, but they were more optimistic about future developments in investment (Chart 13 in Section 3). A net 5% of firms indicated a rise in investment in the first quarter of 2025 (up from a net 4% in the previous quarter). In the second quarter of 2025, a net 11% of firms expect an increase in investment. Across size classes, a net 5% of SMEs and 22% of large firms expect an increase in investment in the second quarter of 2025.
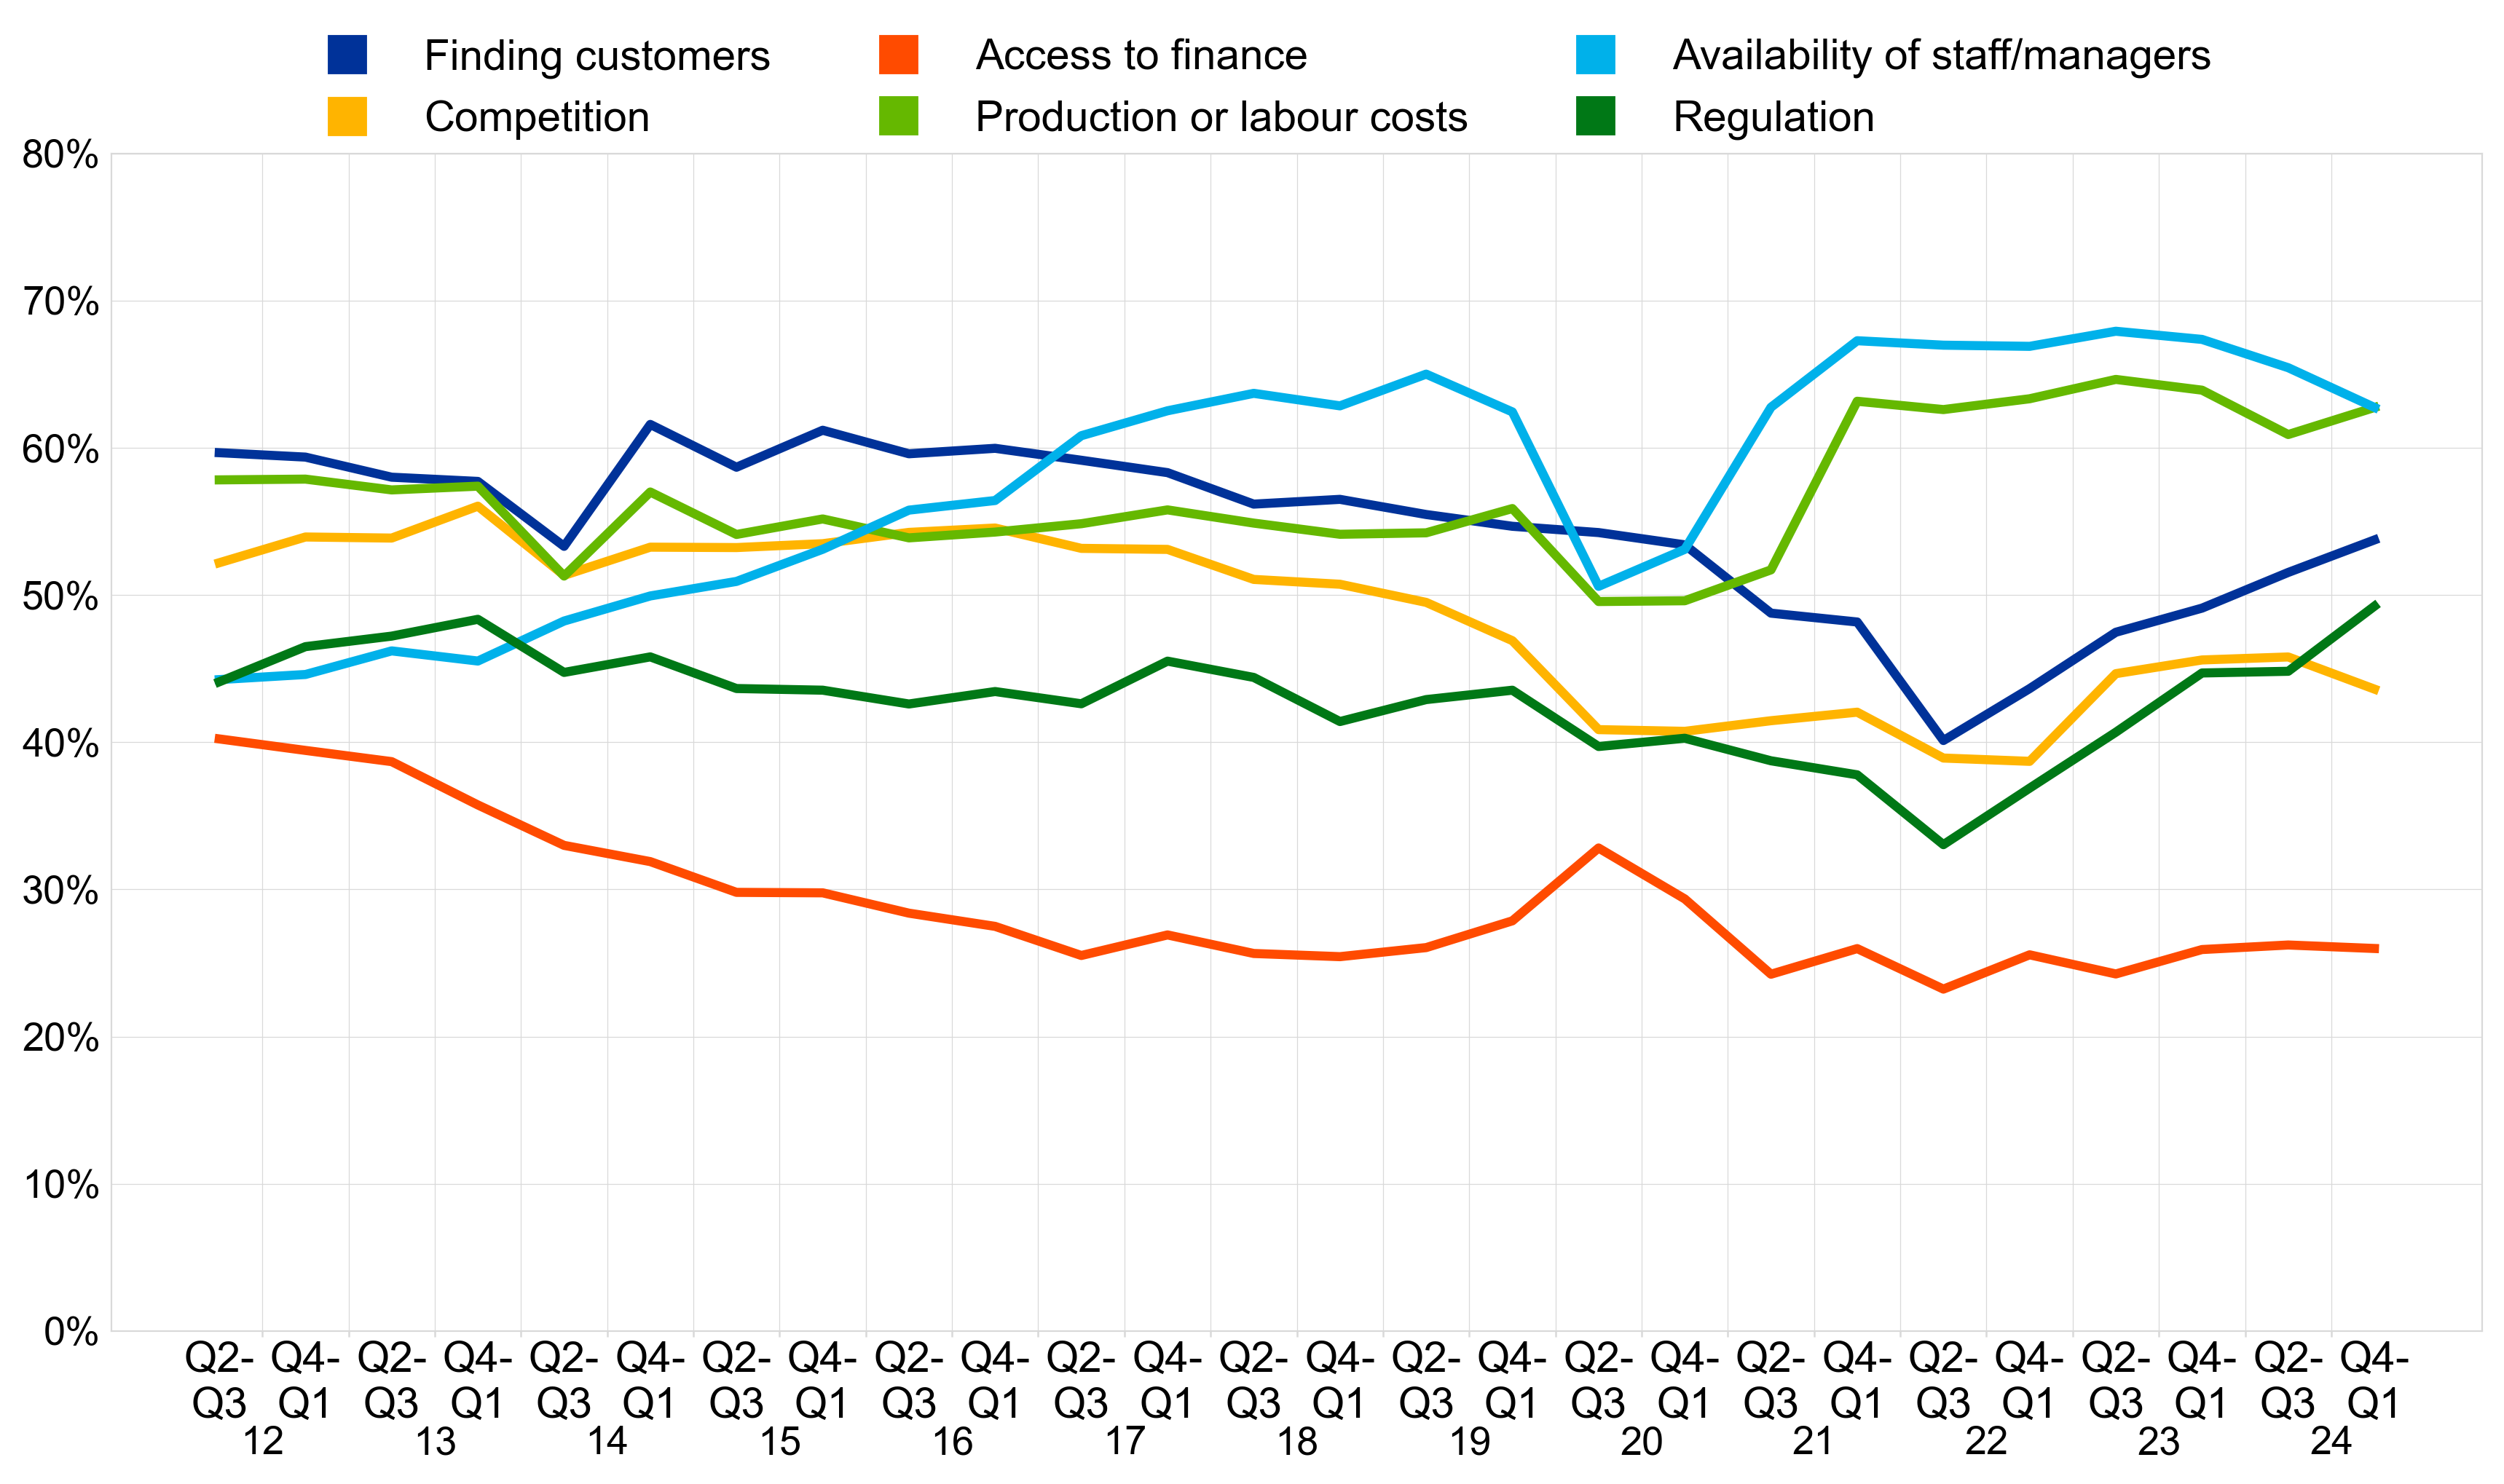
A high share of firms reported problems finding skilled labour and indicated that regulation and the costs of production and labour are key factors limiting production (Chart 14 in Section 3). Over the past six months, the availability of skilled labour remained the most widely reported major concern among firms (signalled by 63%). Furthermore, the share of firms indicating that the costs of production or labour, regulation (including industrial regulation) or finding customers is a serious issue has increased (from 52% to 54% for finding customers, from 61% to 63% for costs of production and from 45% to 49% for regulation).
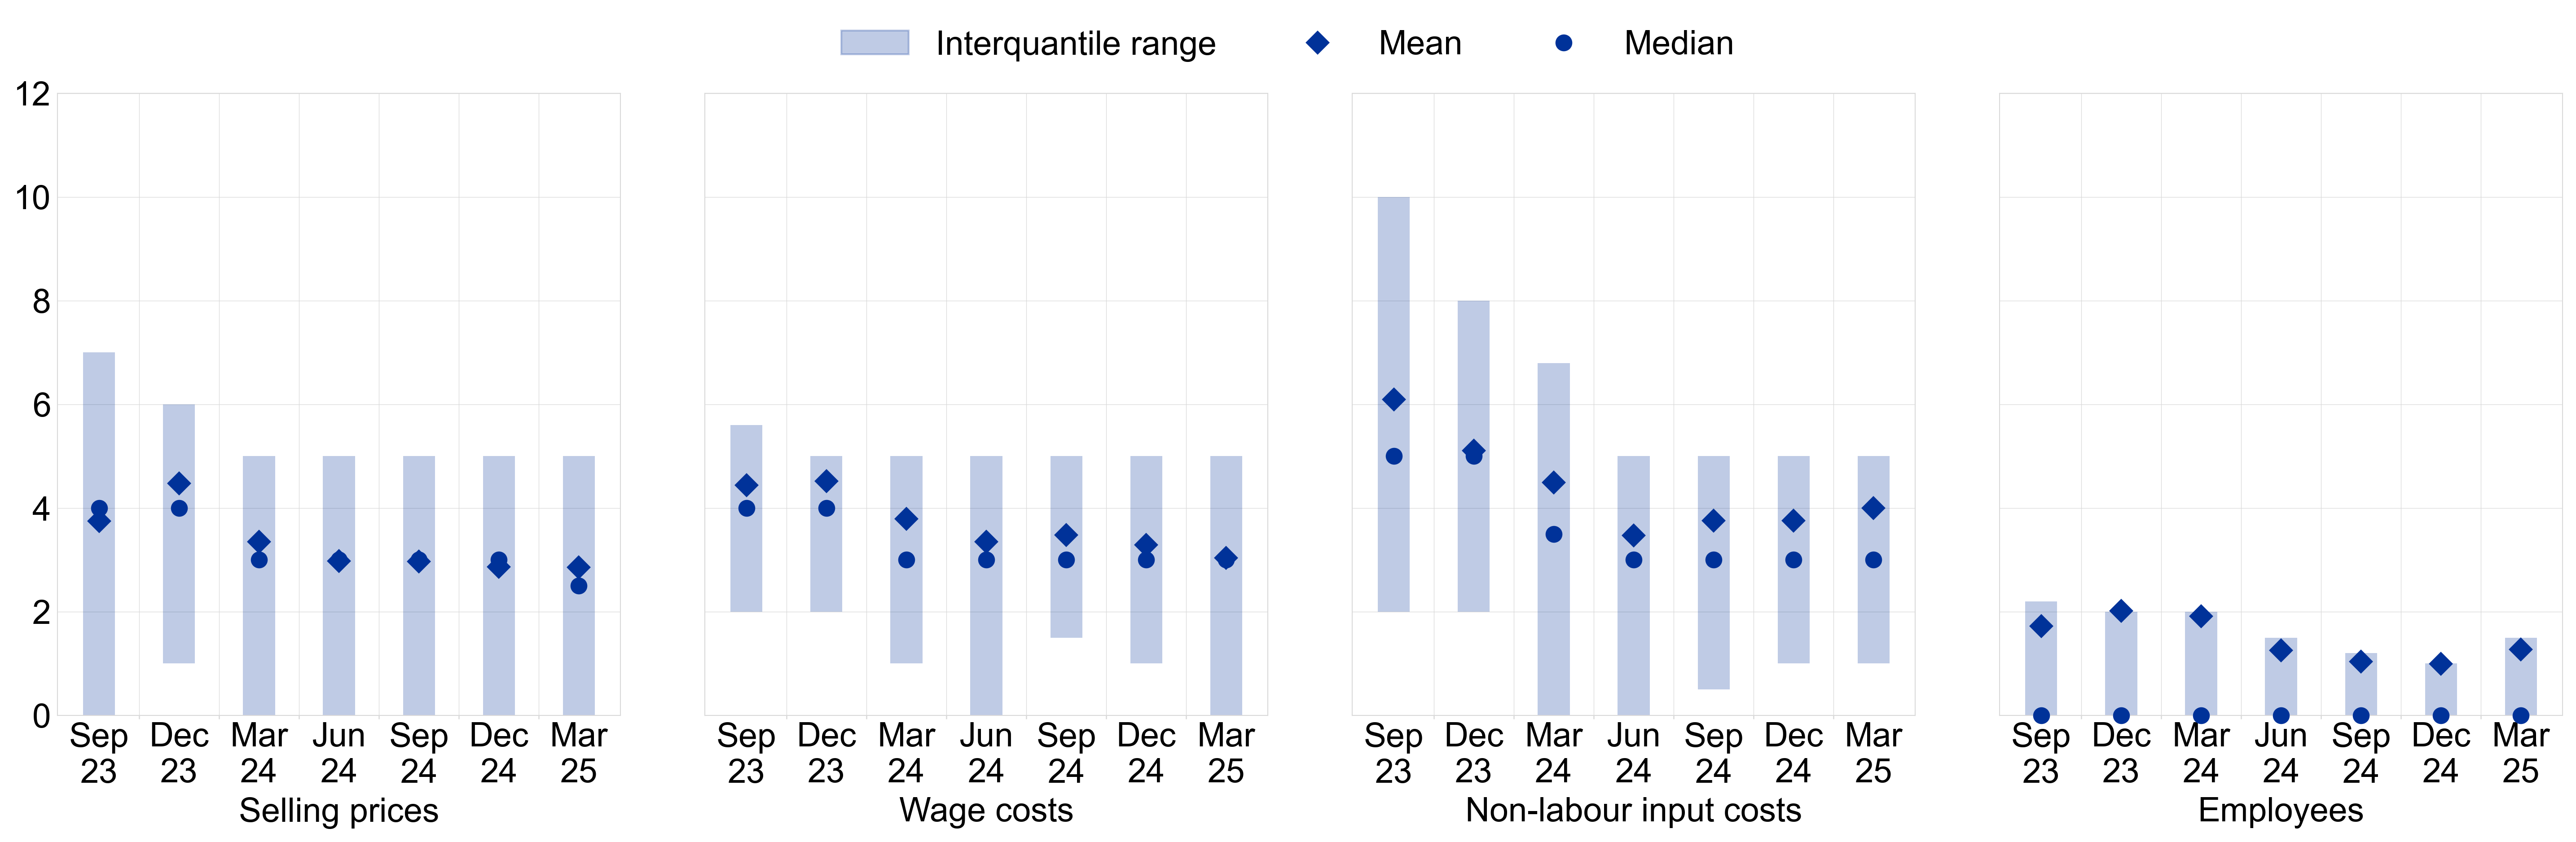
Firms’ expectations of selling prices over the next 12 months remained stable, while expectations for wage growth declined and for non-labour input costs increased (Charts 15-17 in Section 3). Selling prices are expected to increase by 2.9% on average (stable from the previous survey round), while expectations for wage increases stood at 3.0% (from 3.3%). Across size classes, SMEs continue to report higher expectations for selling prices, wage and non-labour input costs than larger firms, while employment growth expectations are more closely aligned across size classes. On average, firms in services expect their selling prices and wages to increase at a stronger pace than firms in trade and industry, however the decline in average expectations for wage growth was driven primarily by lower expected pressures in the services sector. In addition, on average, firms slightly increased their expectations for the next 12 months for non-labour input costs to 4.0% (from 3.8% in previous round), and employment growth to 1.3% (from 1.0% in previous round).
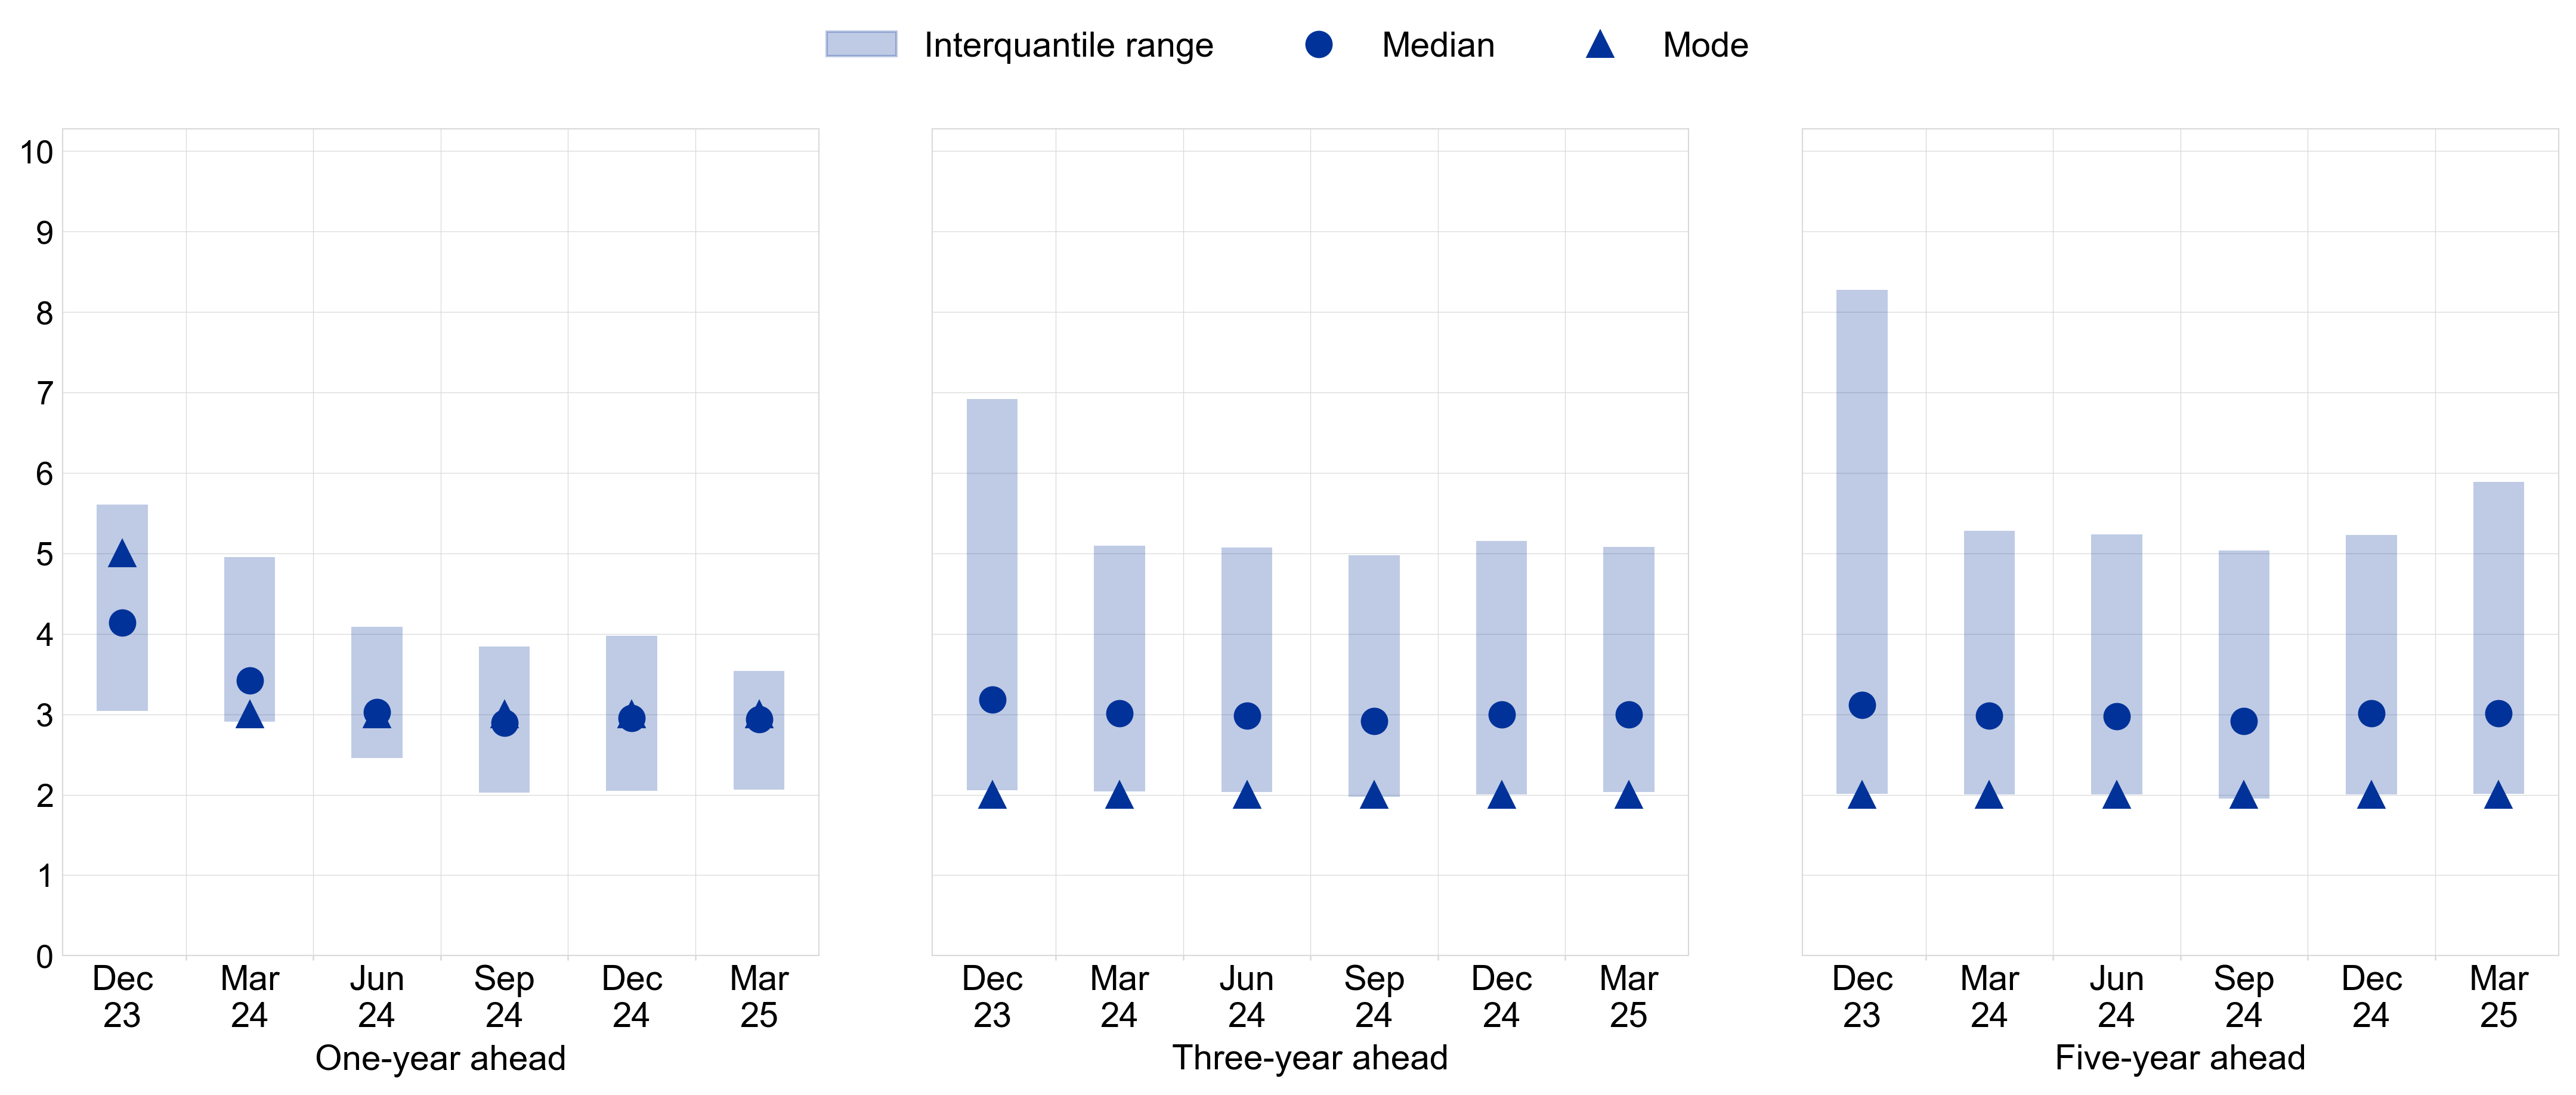
Firms’ median inflation expectations slightly decreased to 2.9% one-year ahead, while remaining unchanged at 3% at longer horizons (Chart 18 in Section 3.4). Overall, SMEs continue to report higher inflation expectations compared with large firms across all horizons. While for the one and three-year horizons there were minor downward revisions for both SMEs and large firms, there was some divergence for the five-year horizon: SMEs revised their expectations upwards to 3.8% (from 3.1%), while the expectations for large firms fell slightly to 2.5% (from 2.7%) (Chart 19).
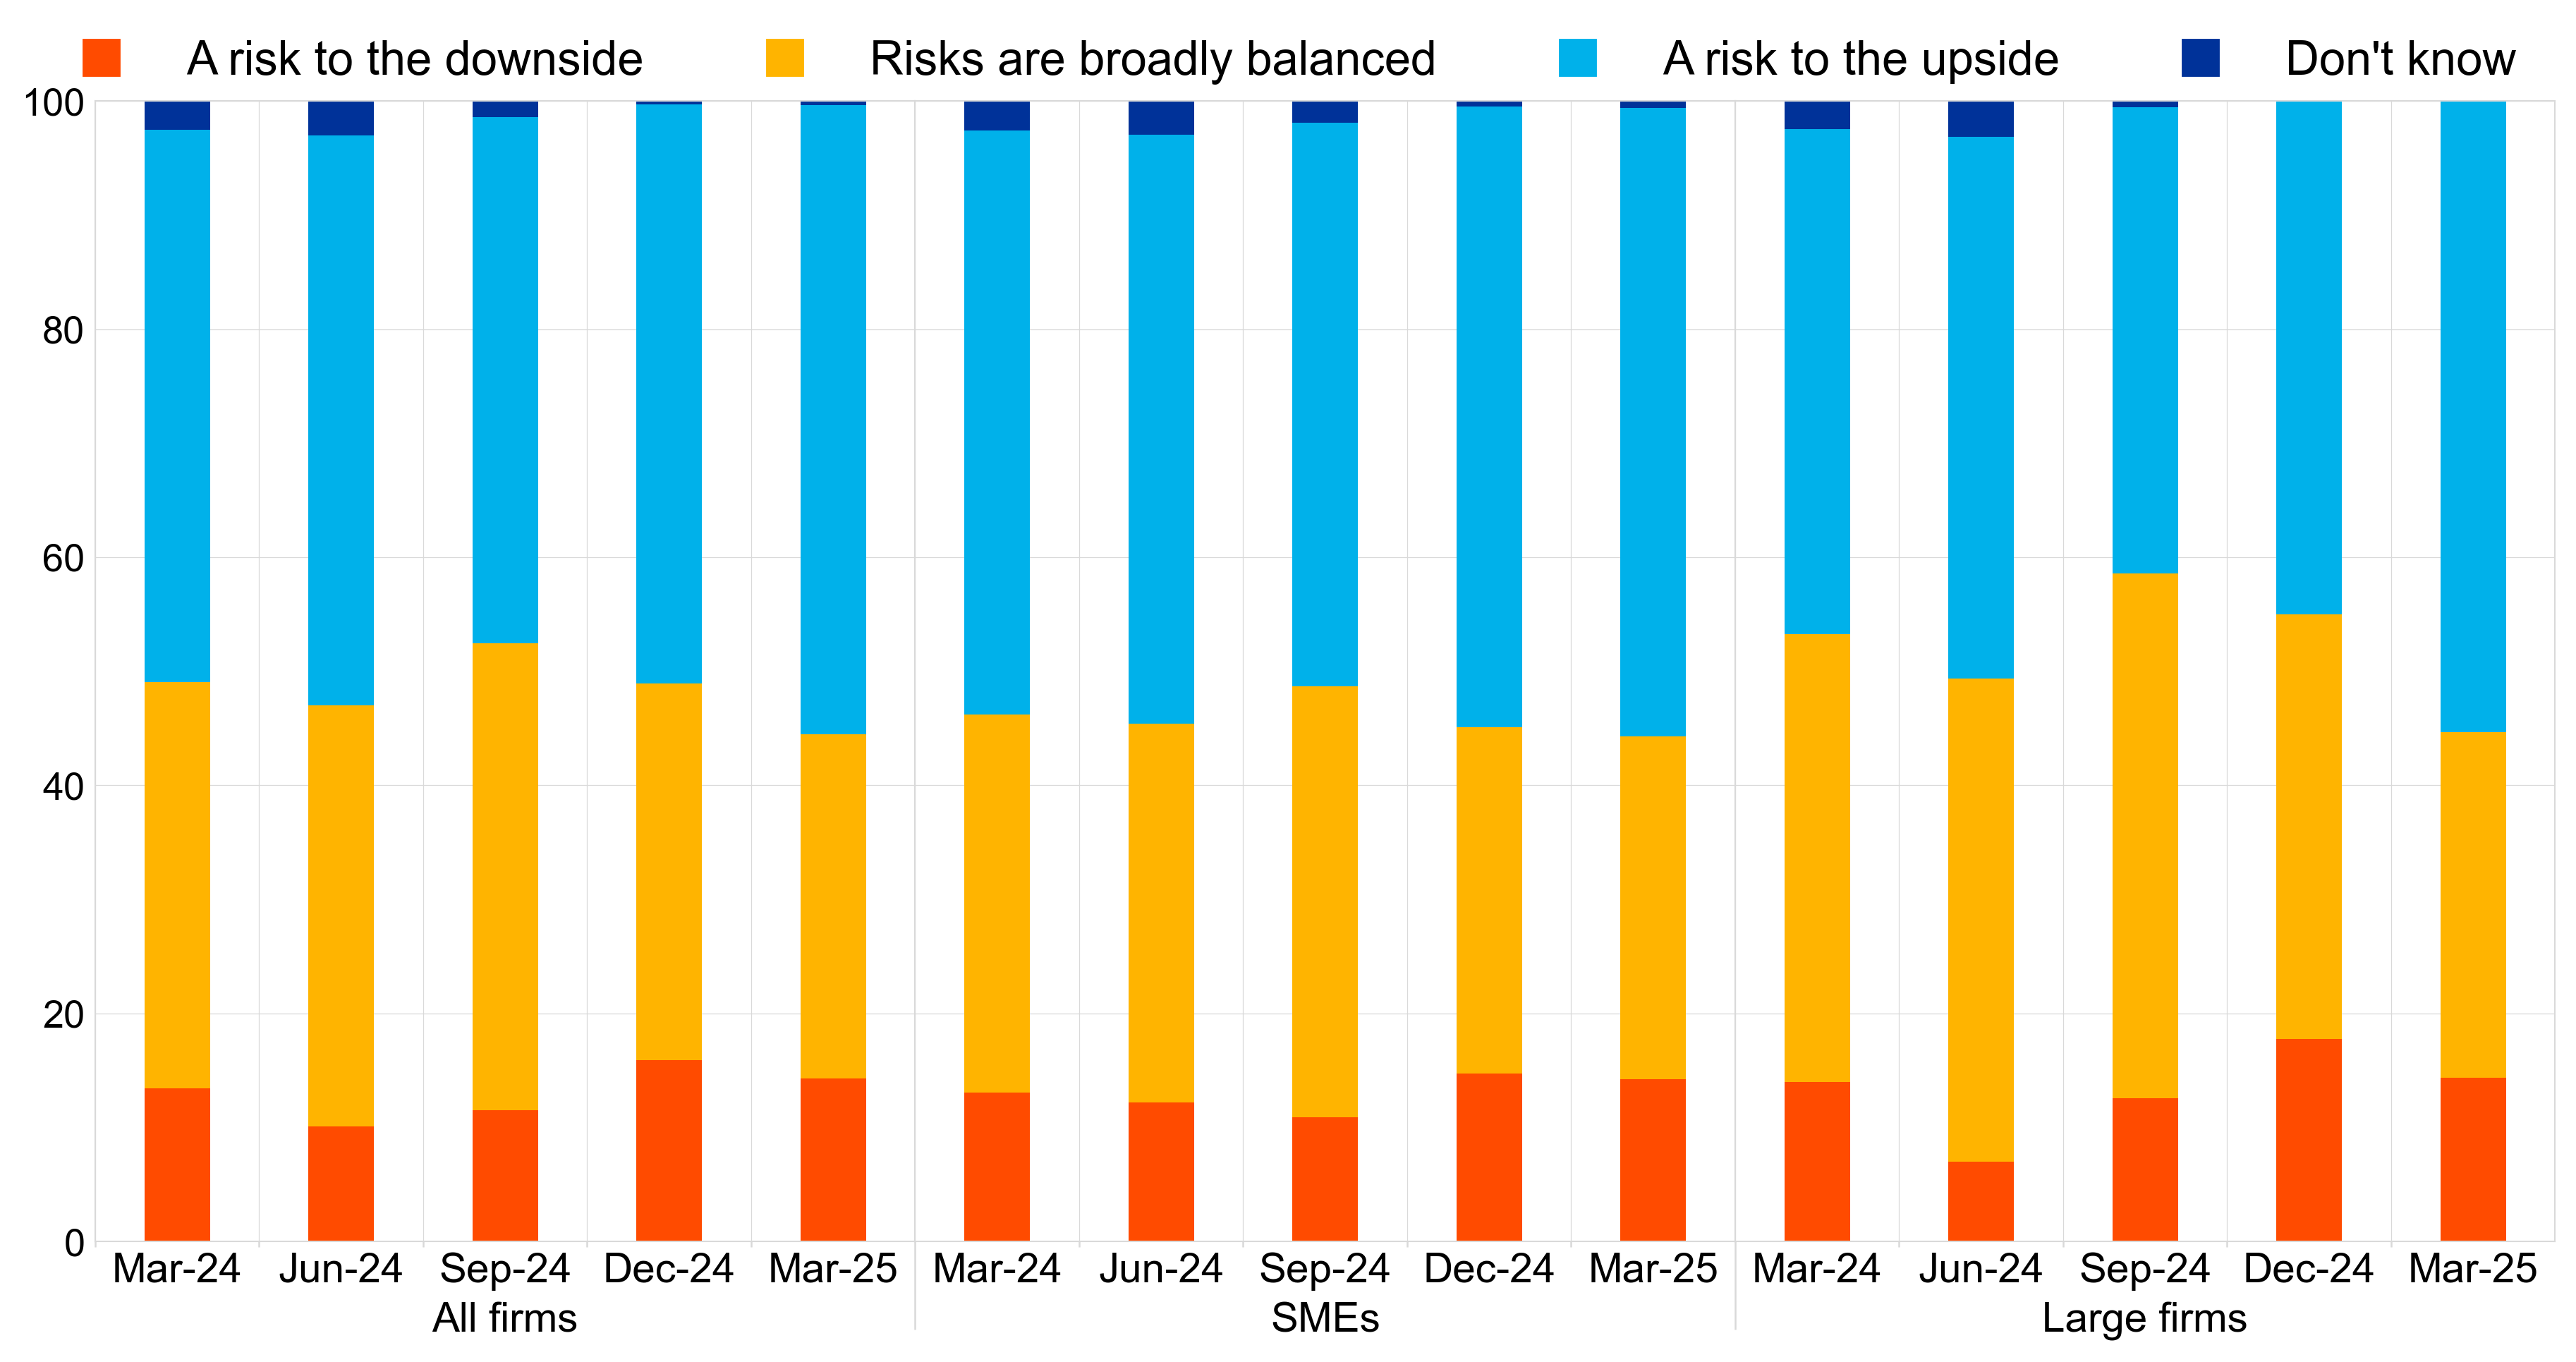
Fewer firms reported that risks to the five-year-ahead inflation outlook are broadly balanced, with more firms perceiving these risks as being tilted to the upside (Chart 20 in Section 3.4). With regard to inflation in the next five years, fewer firms perceived the risks to the outlook as broadly balanced (30%, down from 33%) or to the downside (14%, down from 16%), mirrored by an increase in the percentage of firms seeing upside risks (55%, up from 51%).
Table 1
Latest developments in SAFE country results for euro area firms
(net percentages and percentages of respondents)
Needs |
Availability |
Financing gap (bank loans) |
Financing obstacles |
Vulnerable firms |
||||||||||
|---|---|---|---|---|---|---|---|---|---|---|---|---|---|---|
Bank loans |
Credit lines |
Bank loans |
Credit lines |
|||||||||||
(1) |
(2) |
(3) |
(4) |
(5) |
(6) |
(7) |
(8) |
(9) |
(10) |
(11) |
(12) |
(13) |
(14) |
|
Q4 2024 |
Q1 2025 |
Q4 2024 |
Q1 2025 |
Q4 2024 |
Q1 2025 |
Q4 2024 |
Q1 2025 |
Q4 2024 |
Q1 2025 |
Q4 2024 |
Q1 2025 |
Q4 2024 |
Q1 2025 |
|
Euro area |
0 |
-4 |
5 |
4 |
-2 |
-1 |
-1 |
-1 |
1 |
-1 |
6 |
5 |
4 |
4 |
BE |
3 |
4 |
16 |
13 |
0 |
2 |
-8 |
4 |
1 |
2 |
3 |
6 |
7 |
8 |
DE |
-5 |
-10 |
3 |
-1 |
-10 |
-13 |
-9 |
-8 |
2 |
2 |
8 |
6 |
3 |
4 |
IE |
5 |
4 |
5 |
5 |
3 |
12 |
5 |
6 |
1 |
-5 |
4 |
4 |
7 |
3 |
GR |
4 |
15 |
11 |
19 |
10 |
16 |
18 |
5 |
-3 |
3 |
14 |
13 |
2 |
3 |
ES |
2 |
-5 |
1 |
9 |
8 |
4 |
9 |
3 |
-3 |
-4 |
5 |
6 |
3 |
2 |
FR |
0 |
-2 |
7 |
5 |
-10 |
-3 |
-7 |
-7 |
6 |
1 |
7 |
5 |
4 |
3 |
IT |
2 |
7 |
7 |
11 |
9 |
8 |
6 |
8 |
-3 |
0 |
4 |
3 |
3 |
5 |
NL |
-4 |
-23 |
2 |
-7 |
2 |
0 |
14 |
5 |
-6 |
-11 |
3 |
2 |
4 |
4 |
AT |
4 |
-6 |
-1 |
-1 |
-13 |
3 |
-9 |
0 |
9 |
-4 |
5 |
6 |
3 |
6 |
PT |
1 |
-8 |
3 |
2 |
4 |
10 |
6 |
12 |
-1 |
-11 |
6 |
5 |
4 |
2 |
SK |
1 |
-2 |
5 |
3 |
-4 |
1 |
1 |
4 |
3 |
-3 |
7 |
5 |
5 |
6 |
FI |
24 |
0 |
28 |
13 |
-27 |
-17 |
-27 |
0 |
26 |
11 |
5 |
9 |
8 |
3 |
Notes: For the “financing gap”, see the notes to Chart 2; for “financing obstacles”, see the notes to Chart 10; for “vulnerable firms”, see the notes to Chart 12. “Q4 2024” refers to round 33 (October-December 2024) and “Q1 2025” refers to round 34 (January-March 2025). Financing obstacles and vulnerable firms refer to the percentages of respondents, while the other indicators in the table are expressed in net percentages.
2.1 Firms continued to report a decline in the interest rates on bank loans
In this survey round firms observed a further decrease in bank loan interest rates, while still indicating a tightening of other loan conditions (Chart 1). In the first quarter of 2025 a net 12% of firms reported a decrease in bank loan interest rates, up from a net 4% in the previous quarter. This marks a significant increase in the share of large firms observing a decline in interest rates (‑26%, from ‑7%), while SMEs remained relatively stable in their assessment, with a net 1% reporting a decrease. Meanwhile, a net 24% of firms (from 22% in the fourth quarter of 2024) reported an increase in other financing costs, such as charges, fees and commissions, and a net 13% of firms (from 15% in the fourth quarter of 2024) reported stricter collateral requirements. Across size classes, the share of large firms indicating stricter collateral requirements was lower than that of SMEs. For firms reporting on the past six months, the net percentages of firms indicating declining interest rates (‑11%, from 21% that were reporting increases) and increases in other costs (in net terms, 22%, from 35%) were similar to those for firms reporting on the previous three months.
Chart 1
Changes in the terms and conditions of bank financing for euro area firms
(net percentages of respondents)
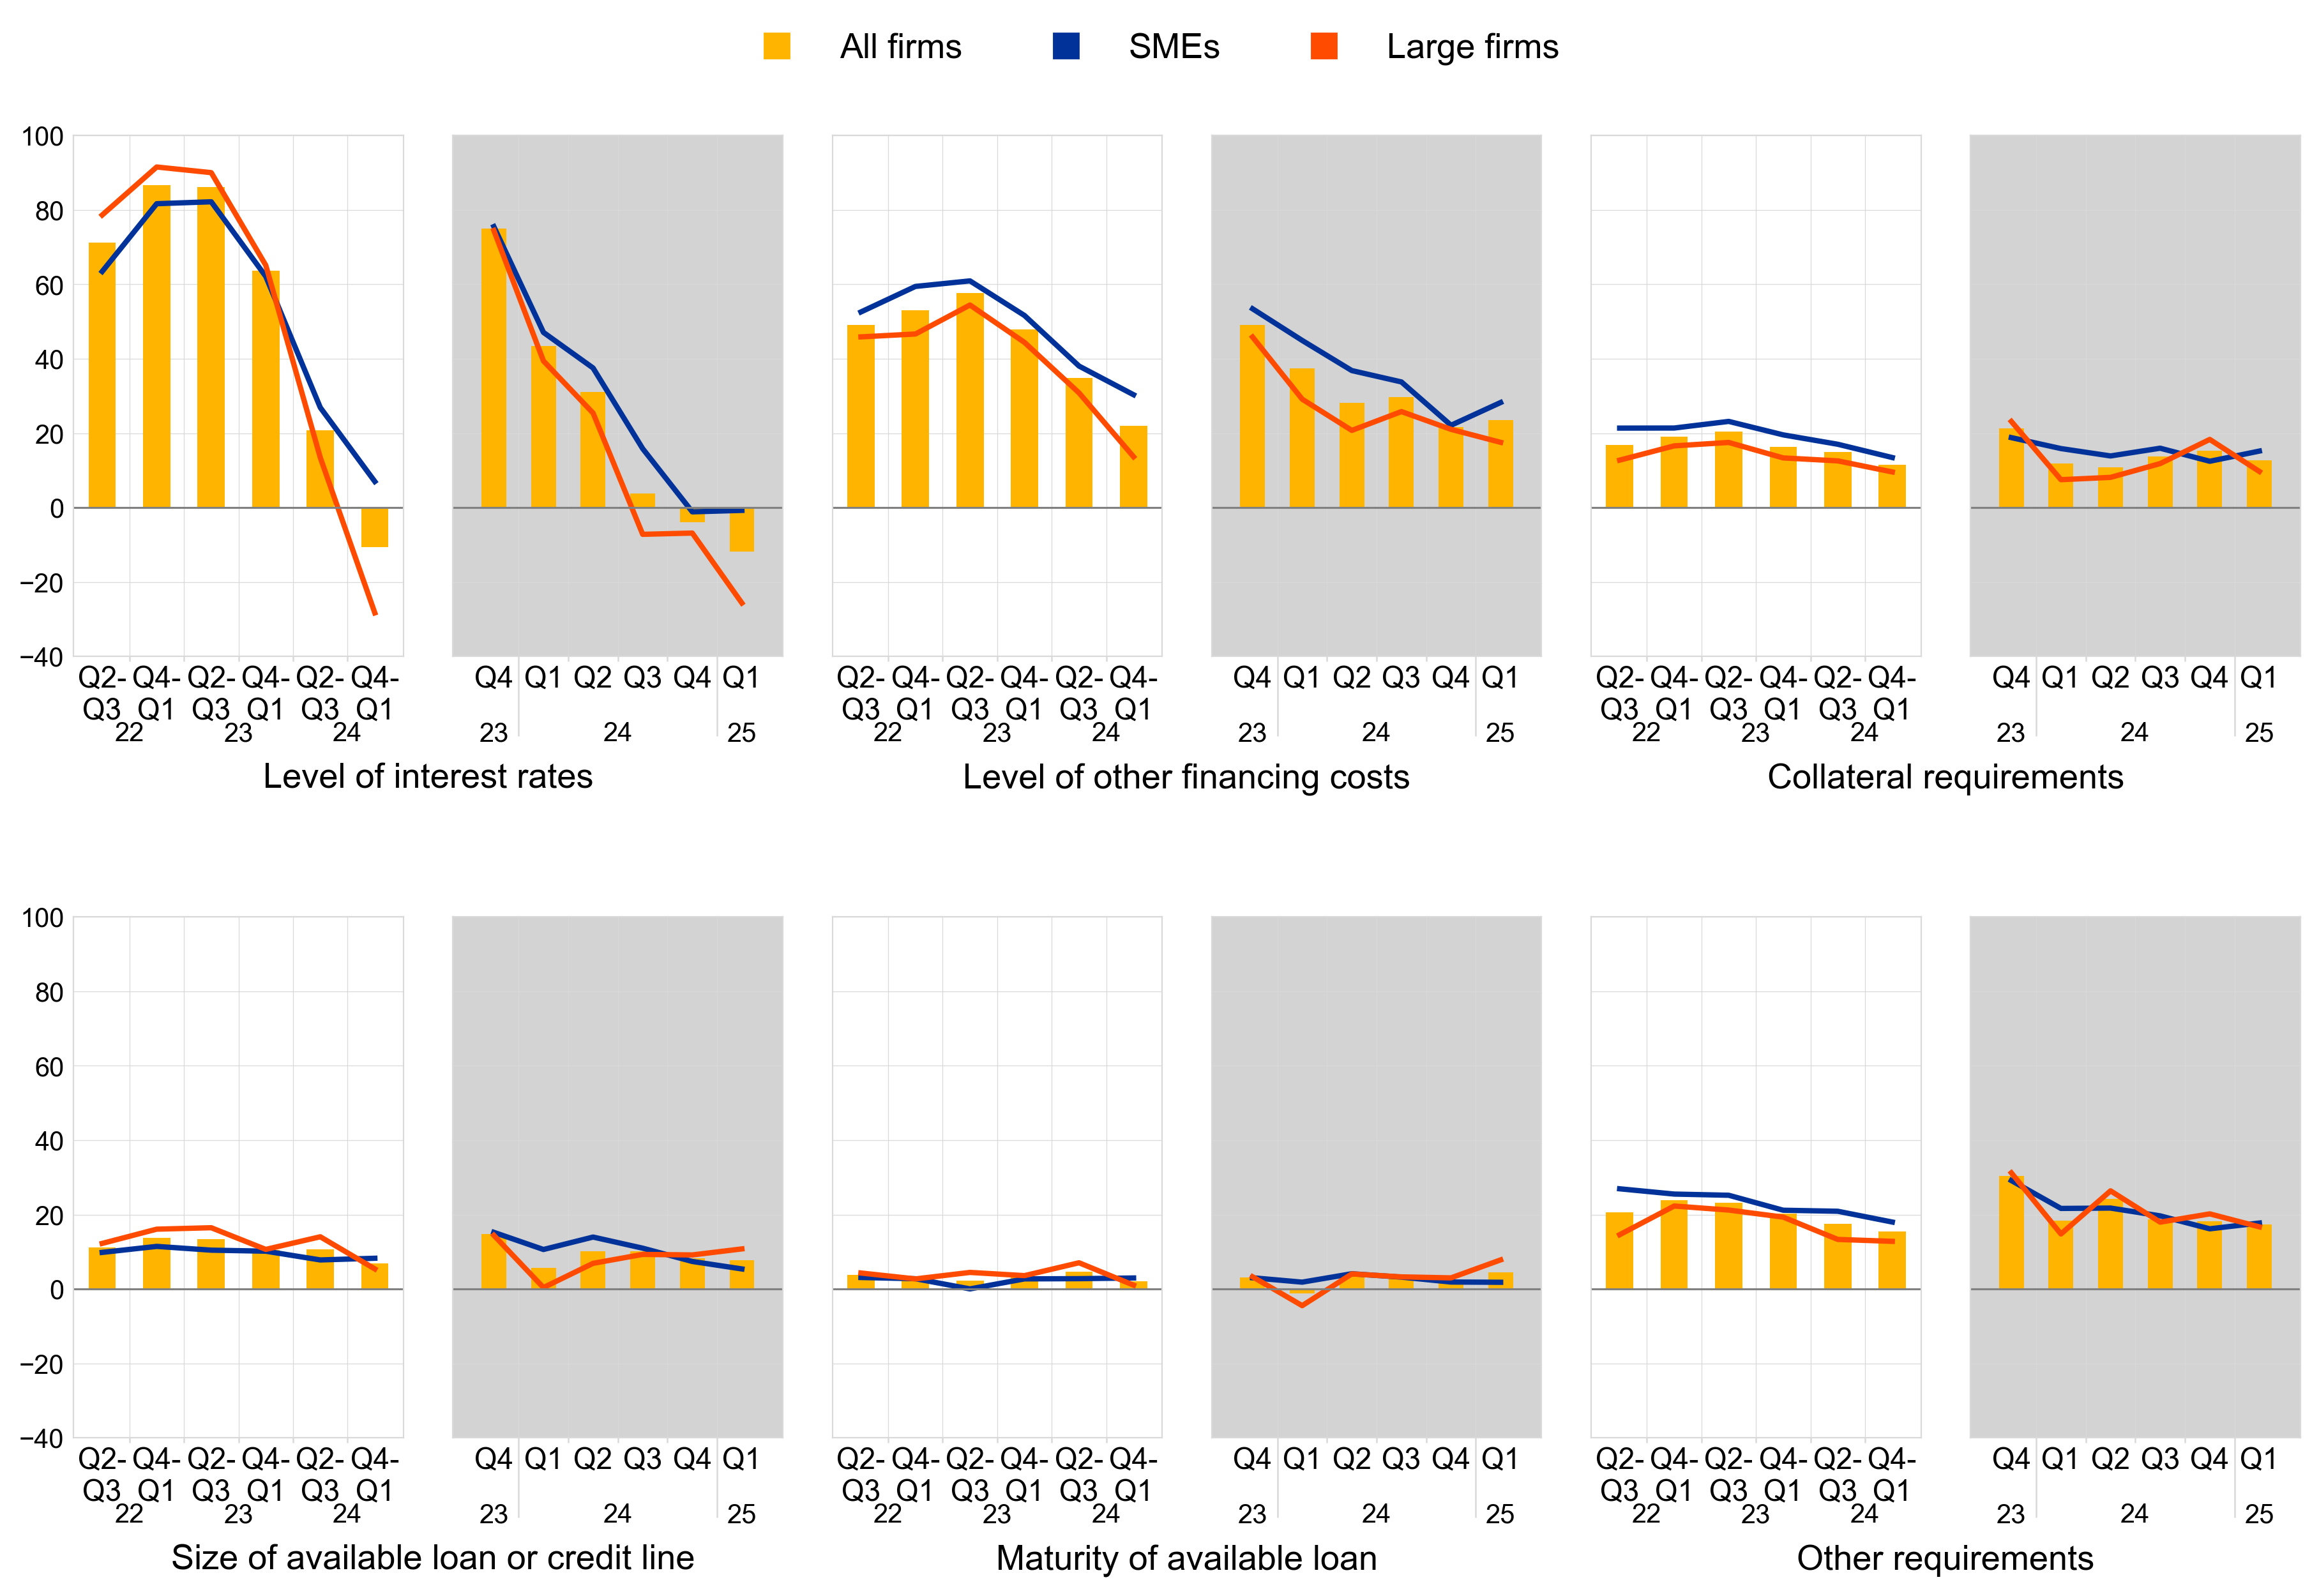
Base: Firms that had applied for bank loans (including subsidised bank loans), credit lines, or bank or credit card overdrafts. The figures refer to rounds 27 to 34 of the survey (April-September 2022 to October 2024-March 2025).
Notes: Net percentages are the difference between the percentage of enterprises reporting an increase for a given factor and the percentage reporting a decrease. The data included in the chart refer to Question 10 of the survey. The grey panels represent responses to the same question for three-monthly reference periods, whereas the white panels relate to six-monthly reference periods.
2.2 Broadly stable availability, coupled with a decline in needs, left the bank loan financing gap virtually unchanged
Firms reported a reduction in the need for bank loans (Chart 2). In the first quarter of 2025, firms reported a reduction in the need for bank loans (a net -4%, compared with 0% in the previous quarter), with relatively more large firms indicating a decline (a net ‑6%, from a net 3% indicating an increase in the previous quarter) than SMEs (a net ‑2%, unchanged from the previous quarter).
The availability of bank loans was broadly unchanged (Chart 2). The net percentage of firms reporting a decline in the availability of bank loans was 1% (from 2% in the previous quarter). SMEs observed a small decline in the availability of bank loans, while large firms saw no change. These developments are echoed by the slight net tightening in banks’ lending policies, particularly concerning credit standards, as highlighted by the euro area bank lending survey during the same period. The bank loan financing gap indicator – an index capturing the difference between changes in needs and availability – was broadly unchanged (a net ‑1%, compared with a net 1% of firms experiencing an increase in the financing gap in the previous quarter). While SMEs reported no change in the financing gap (which remained at 0%), a net 3% of large firms indicated that the bank loan availability exceeded their needs, the financing gap having shifted from a positive in the previous three months to a negative. Firms reporting over the last six months appear to be more optimistic about changes in bank loan availability despite a slight increase in their needs. As a result, on average, they reported no changes in their financing gap.
Chart 2
Changes in euro area firms’ financing needs and the availability of bank loans
(net percentages of respondents)
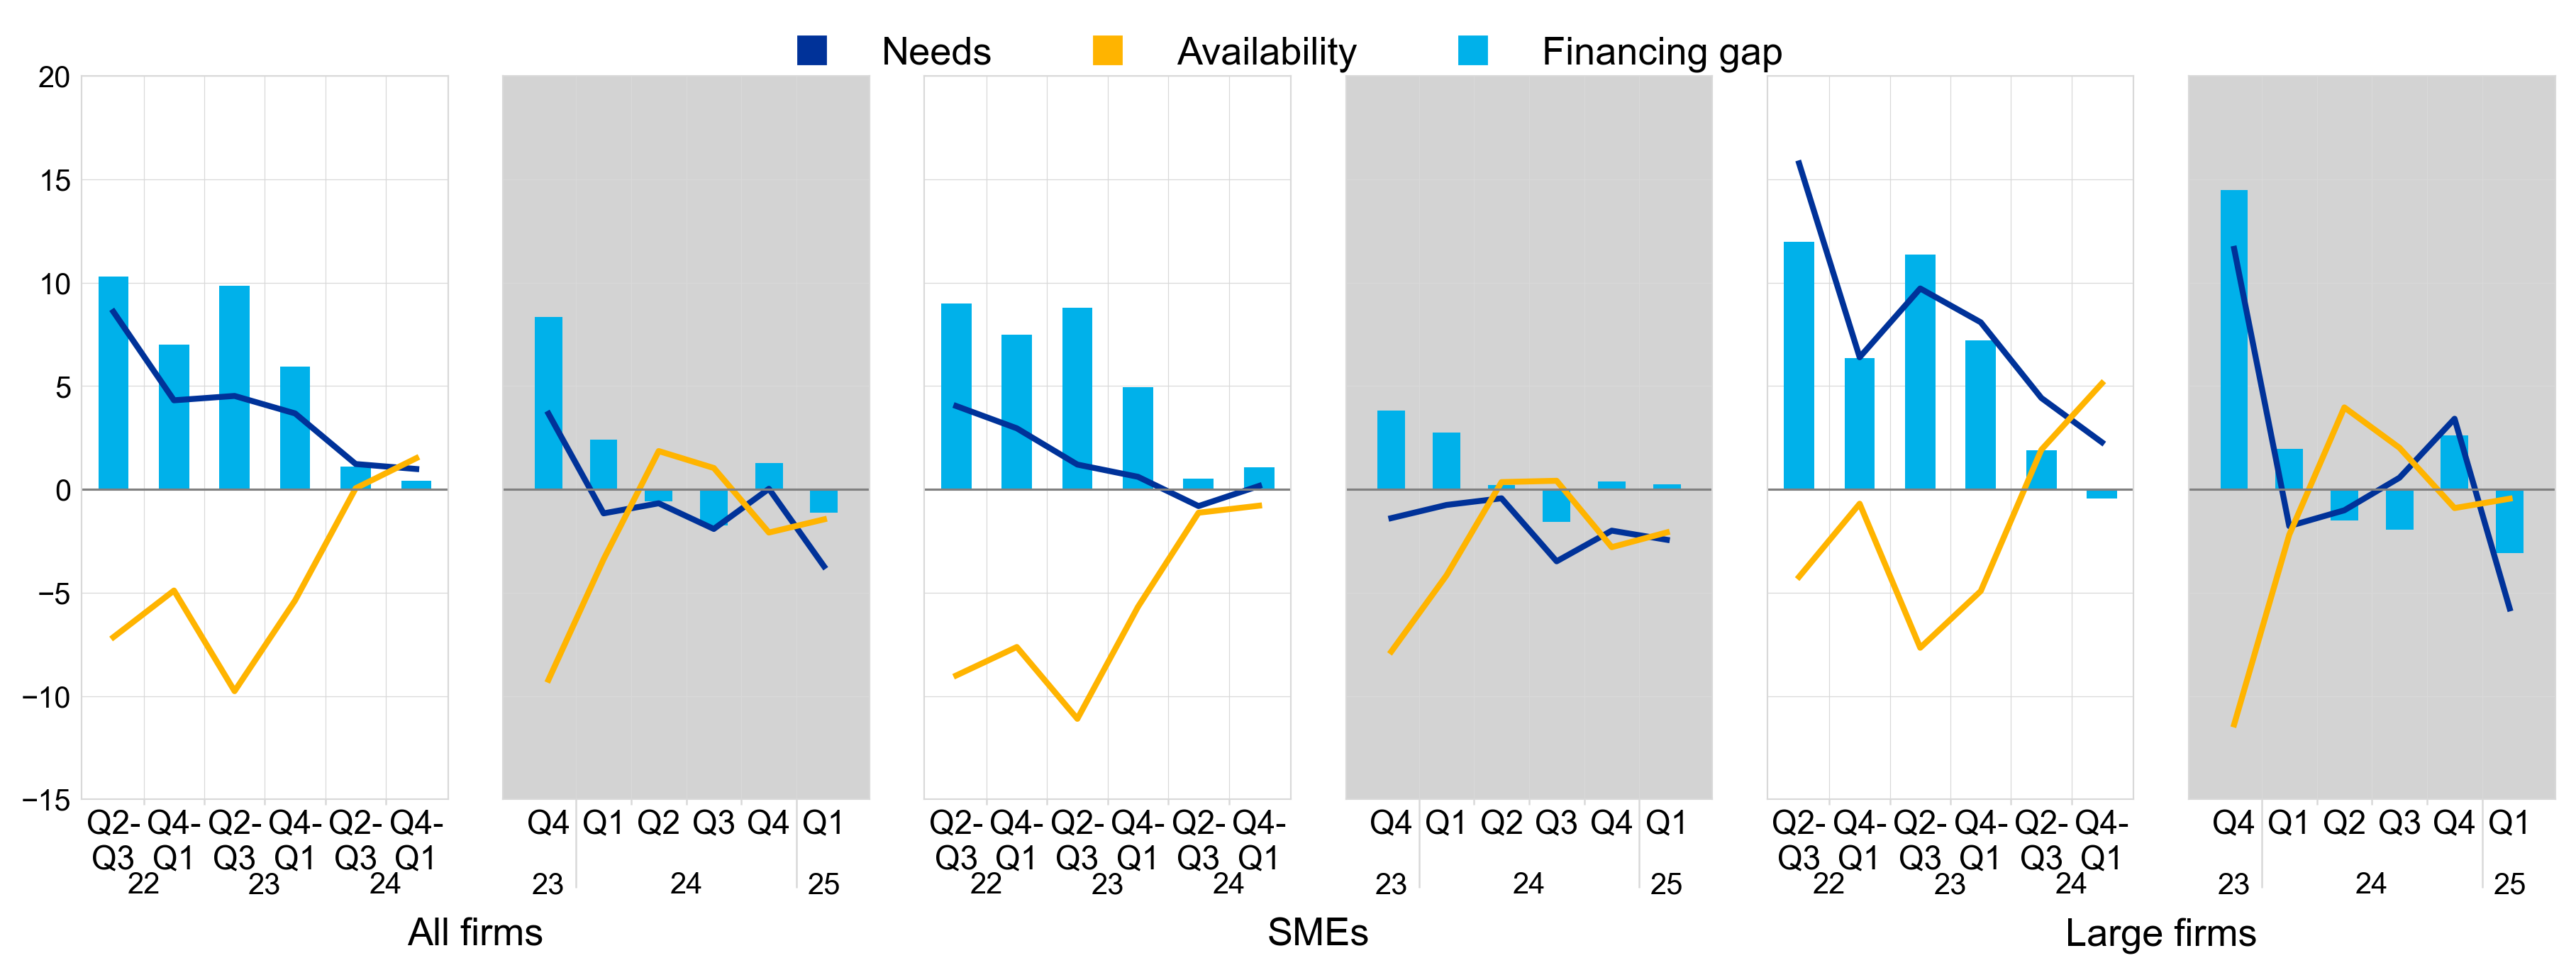
Base: Firms for which the instrument in question is relevant (i.e. they have used it or considered using it). Respondents replying “not applicable” or “don’t know” are excluded. The figures refer to rounds 27 to 34 of the survey (April-September 2022 to October 2024-March 2025).
Notes: The financing gap indicator combines both financing needs and the availability of bank loans at firm level. The indicator of the perceived change in the financing gap takes a value of 1 (-1) if the need increases (decreases) and availability decreases (increases). If firms perceive only a one-sided increase (decrease) in the financing gap, the variable is assigned a value of 0.5 (-0.5). A positive value for the indicator points to a widening of the financing gap. Values are multiplied by 100 to obtain weighted net balances in percentages. The data included in the chart refer to Questions 5 and 9 of the survey. The grey panels represent responses to the same question for three-monthly reference periods, whereas the white panels relate to six-monthly reference periods.
Firms reported a moderate increase in the need for trade credit, with some increase in availability (Chart 3). A net 7% of companies reported a higher need for trade credit, from a net 10% in the previous quarter. At the same time, a net 3% of firms (unchanged from the previous quarter) signalled increased availability.
Fewer firms reported an increased need for credit lines, while availability declined slightly (Chart 3). In this survey round, a net 4% of firms reported an increased need for credit lines (from a net 5% in the fourth quarter of 2024), while continuing to signal a slight decline in availability (a net ‑1%, virtually unchanged).
Chart 3
Changes in euro area firms financing needs and the availability of trade credit and credit lines
(net percentages of respondents)
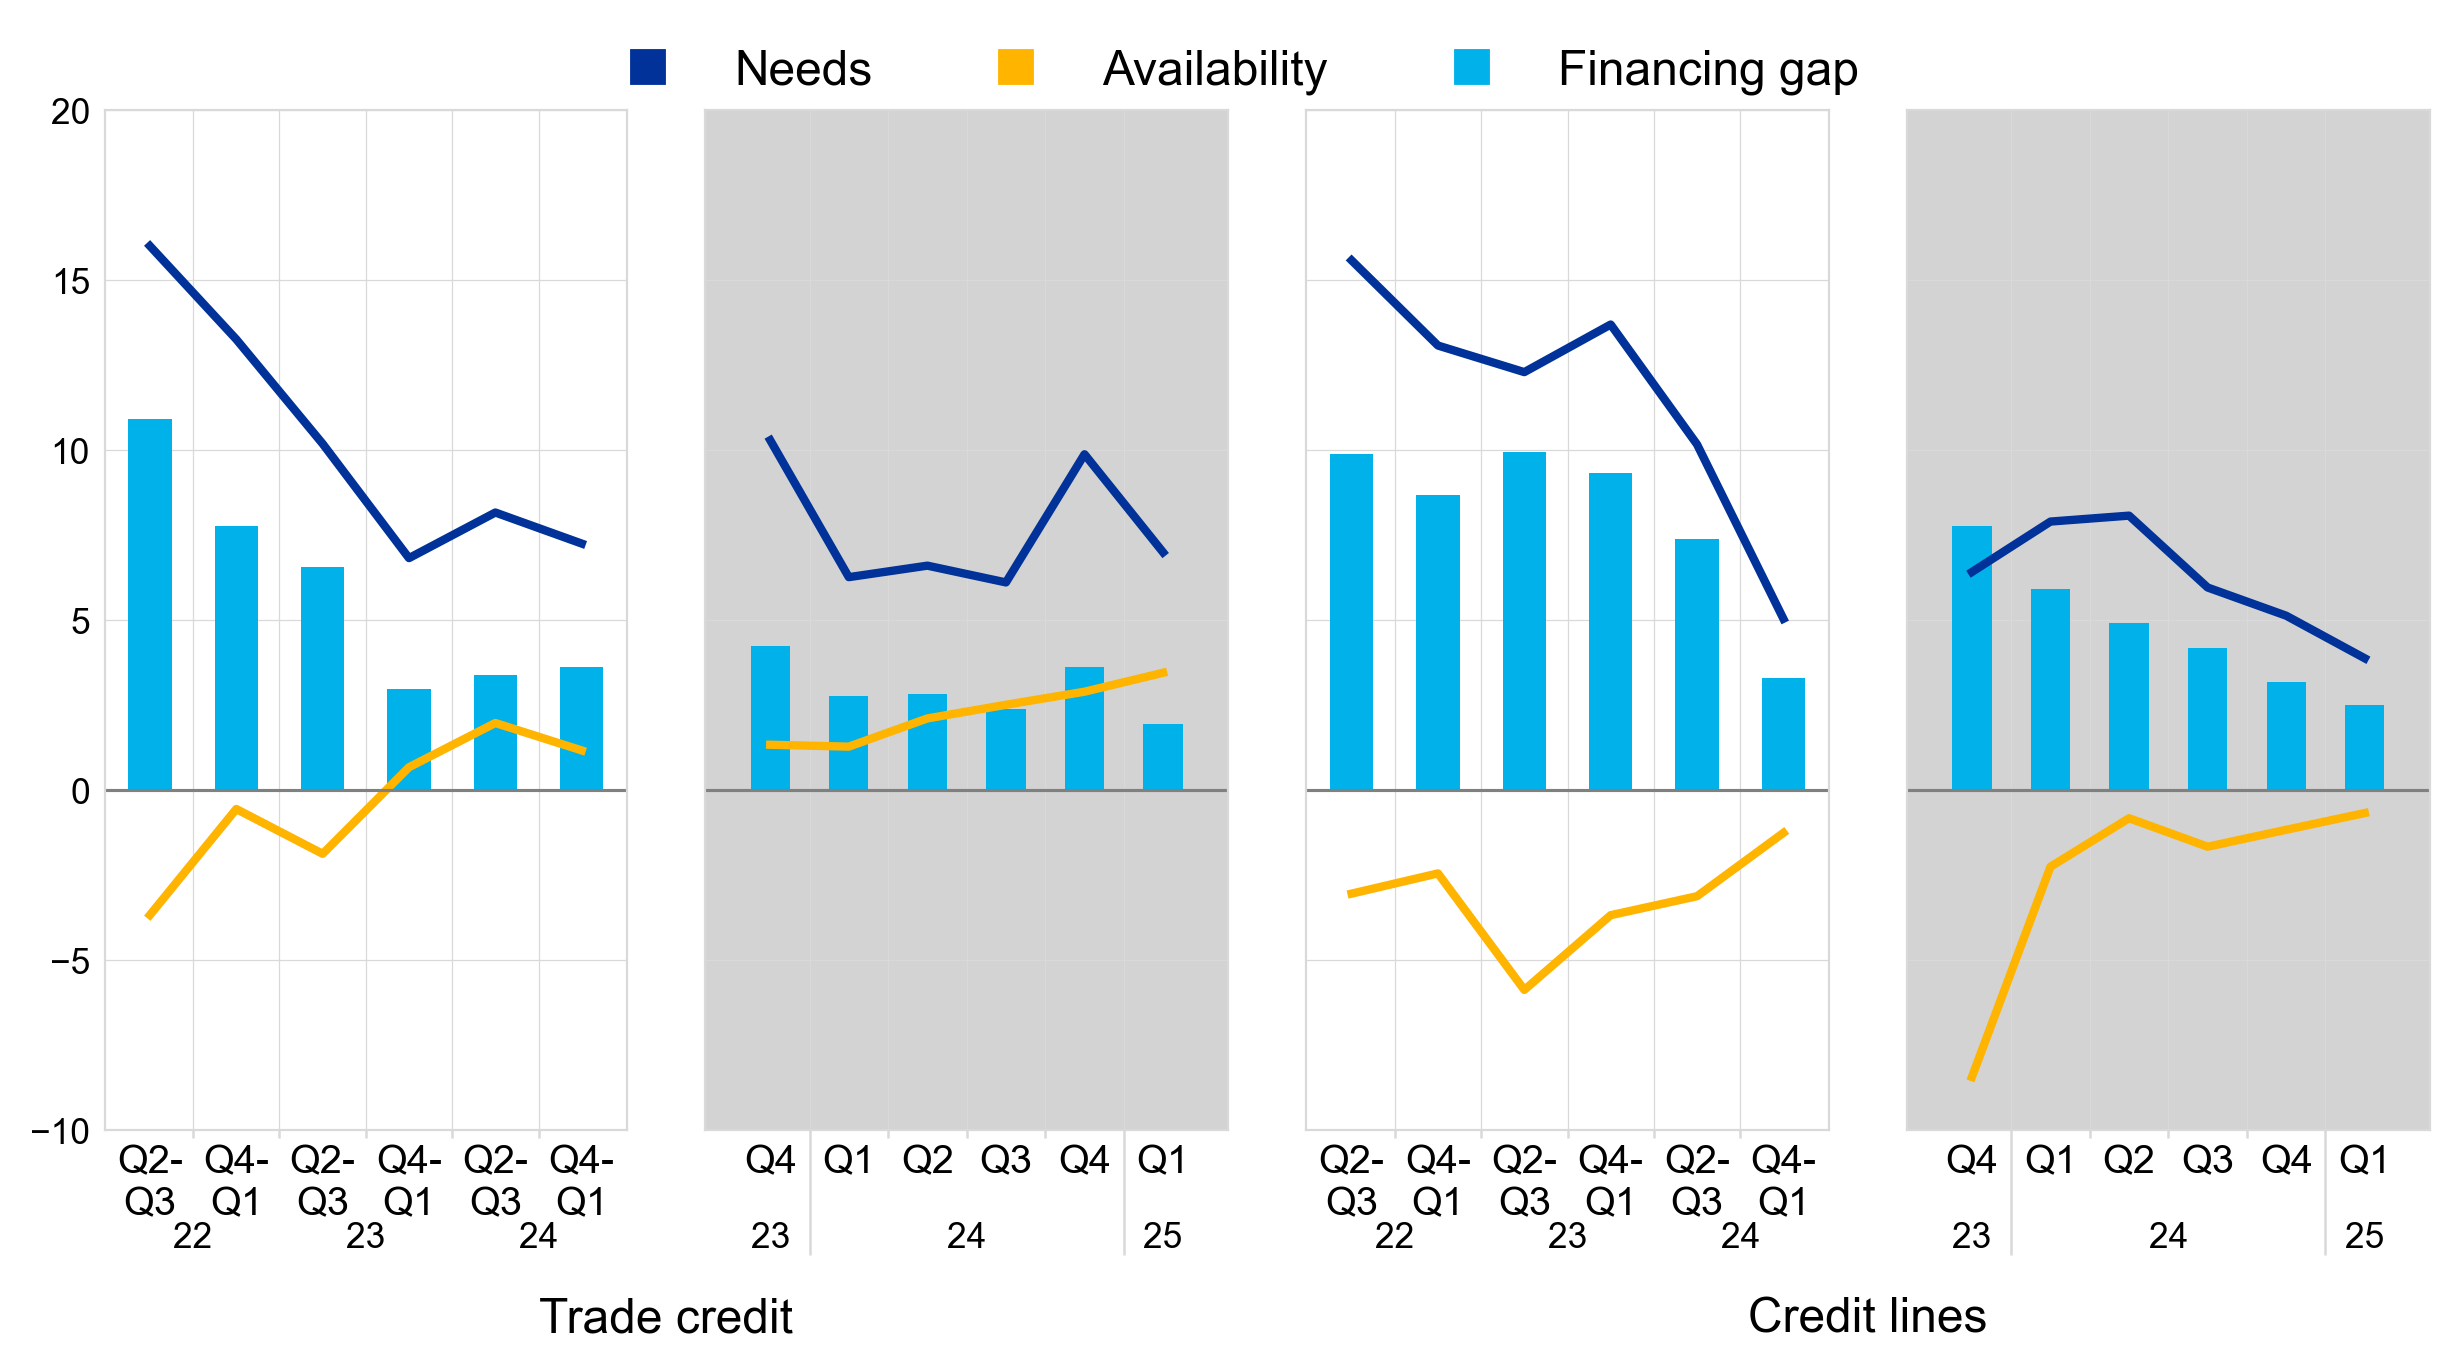
Base: Firms for which the instrument in question is relevant (i.e. they have used it or considered using it). Respondents replying “not applicable” or “don’t know” are excluded. The figures refer to rounds 27 to 34 of the survey (April-September 2022 to October 2024-March 2025).
Notes: For a description of the indicator, see the notes to Chart 2. The data included in the chart refer to Questions 5 and 9 of the survey. The grey panels represent responses to the same question for three-monthly reference periods, whereas the white panels relate to six-monthly reference periods.
The composite financing gap indicator– which includes bank loans, credit lines and trade credit as well as debt securities and equity – remained broadly unchanged, after a modest increase in the last survey round (Chart 4). A net 1% of firms signalled an increase in the composite financing gap, down from a net 3% in the previous six months, which covered the second and third quarters of 2024. This decline reflects smaller, albeit still positive, financing gaps for all financial instruments, except trade credit. The current composite financing gap is reaching levels historically associated with periods of monetary policy easing.[3]
Chart 4
Changes in the composite financing gap for euro area firms and its components
(net percentages of respondents)
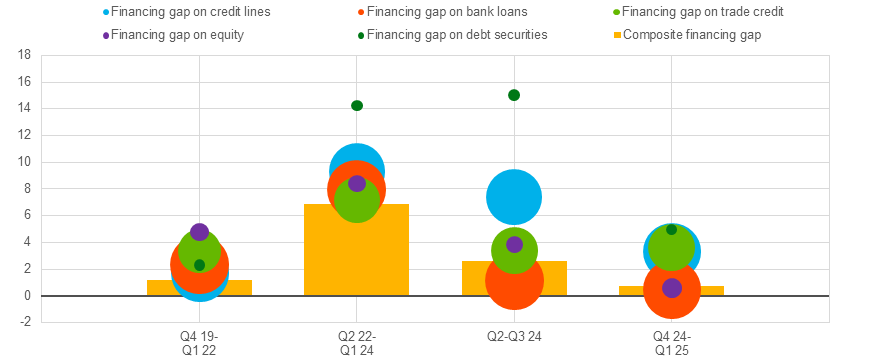
Base: All firms.
Notes: The financing gap indicators combine both financing needs and the availability of bank loans, trade credit, equity, debt securities and credit lines at firm level. For each of the five financing instruments, the indicator of the perceived change in the financing gap takes a value of 1 (-1) if the need increases (decreases) and the availability decreases (increases). If firms perceive only a one-sided increase (decrease) in the financing gap, the variable is assigned a value of 0.5 (-0.5). The composite financing gap is computed at firm level by adding together the financing gaps for each relevant source of financing and then dividing this total by the number of these sources. A positive value for the indicator points to an increase in the financing gap. Values are multiplied by 100 to obtain weighted net balances in percentages. In the chart, the centre of each bubble represents the financing gap of the corresponding source of financing, while the size represents the shares of firms using the instrument. The data included in the chart refer to Questions 5 and 9 of the survey. The latest observation is for round 34 (October 2024-March 2025) of the survey.
2.3 Firms used financing primarily for fixed investment and for inventories and working capital
Financing from external and internal sources continued to be used primarily for fixed investment and for inventories and working capital (Chart 5). Fixed investment was identified as the most common use of financing, reported by 46% of firms, followed by the replenishment of inventories and working capital, as indicated by 39% of firms. Generally, large firms are more likely to report using external financing for fixed investments, and their usage has increased over the past two years. In contrast, the trend has remained relatively unchanged for SMEs. Similarly, the share of firms securing financing for inventories and working capital has generally been consistent over the same period, indicating no significant supply bottlenecks.
Chart 5
Purpose of financing as reported by euro area firms
(percentages of respondents)
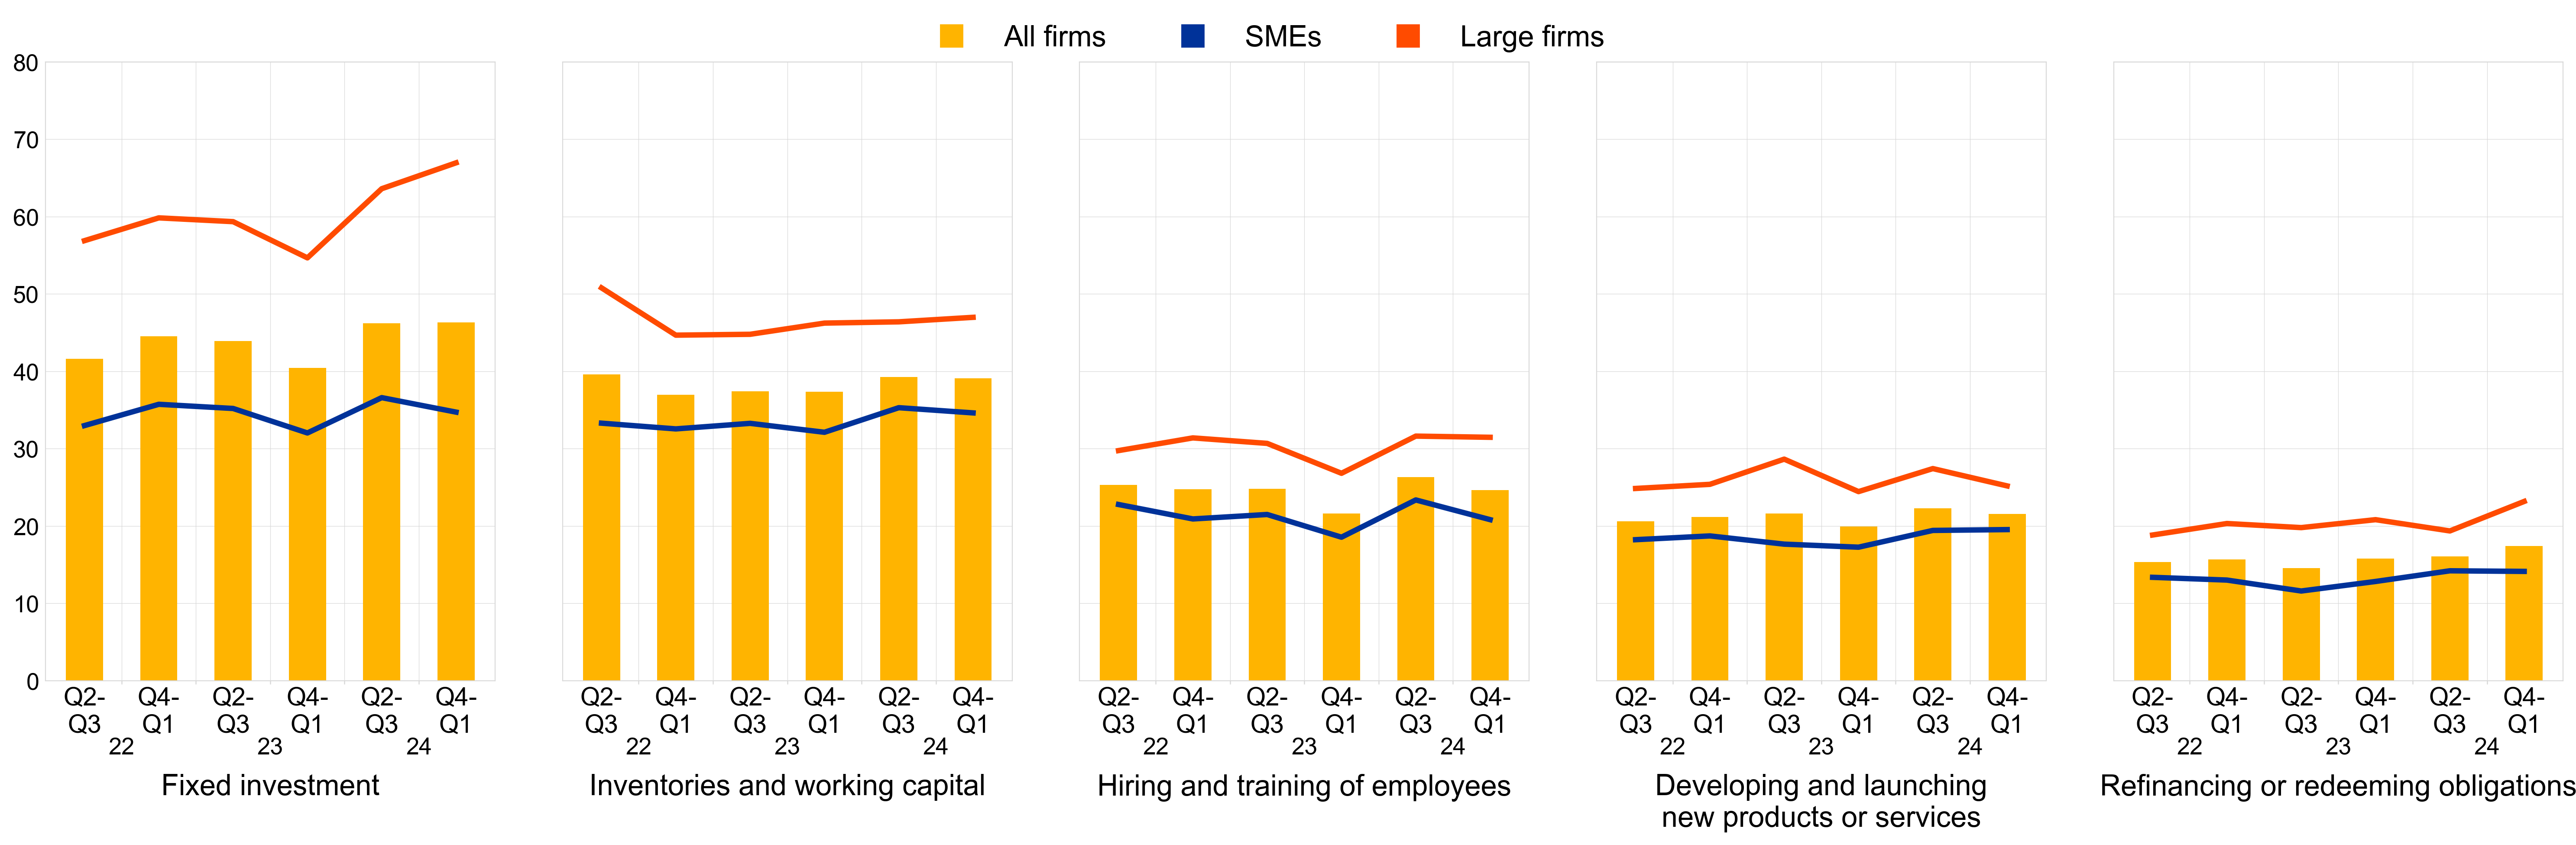
Base: All firms. The figures refer to rounds 27 to 34 of the survey (April-September 2022 to October 2024-March 2025).
Note: The data included in the chart refer to Question 6A of the survey.
2.4 Firms expect a modest improvement in the availability of external financing
Looking ahead, firms expect the availability of external financing to improve slightly over the next three months, as in the previous survey round (Chart 6). A net 2% of firms expect improved access to bank loans and a net 3% foresee better credit line availability. Furthermore, firms do not anticipate changes in trade credit availability. Unlike SMEs, large firms expect a slight decline in trade credit availability, likely due to concerns about deteriorating business activity, which could prompt more cautious lending practices by suppliers. Over the next six months, firms remain optimistic overall, except as regards future trade credit availability, where large firms expect a decline.
Chart 6
Changes in euro area firms' expectations regarding the availability of financing
(net percentages of respondents)
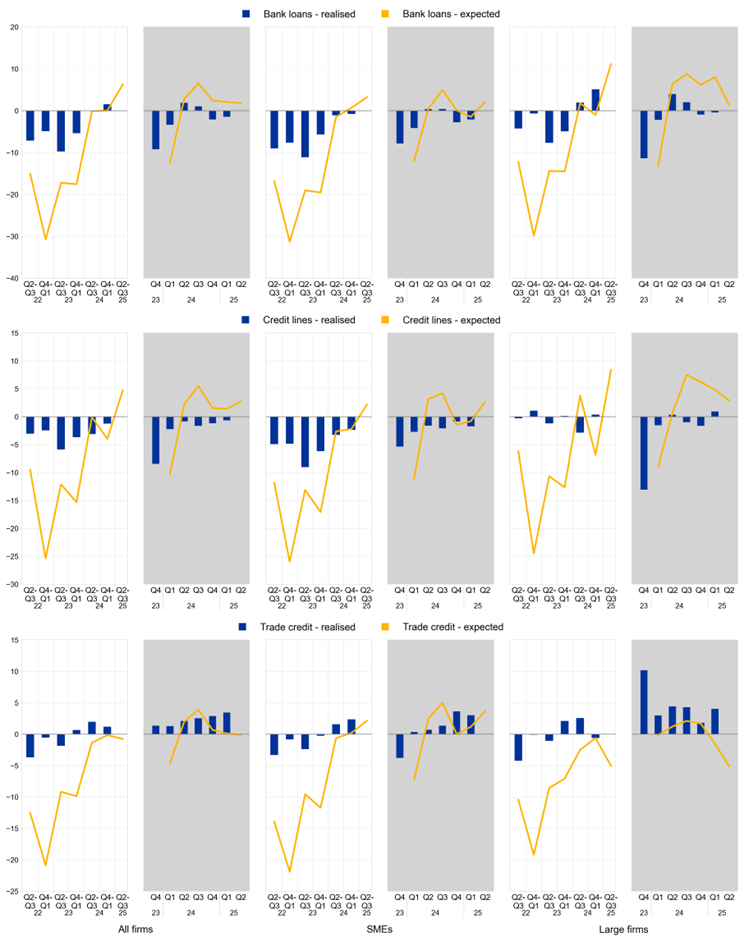
Base: Firms for which the instrument in question is relevant (i.e. they have used it or considered using it). The figures refer to rounds 27 to 34 of the survey (April-September 2022 to October 2024-March 2025).
Notes: See the notes to Chart 1. The data included in the chart refer to Questions 9 and 23 of the survey. The expectation line has been shifted forward by one period to allow for direct comparison with realisations. The grey panels represent responses to the same question for three-monthly reference periods, whereas the white panels relate to six-monthly reference periods.
2.5 Enterprises perceived the general economic outlook as negatively affecting the availability of external finance
Firms continued to perceive the general economic outlook as the main factor hampering the availability of external financing (Chart 7). In the first quarter of 2025, a net 21% of firms reported that a deterioration in the general economic outlook had reduced the availability of external financing, from a net 22% in the fourth quarter of 2024. In the latest survey round, SMEs were more pessimistic than large firms when reporting a deterioration in availability due to the general economic outlook (a net 22%, from a net 23%, compared with a net 18% of large firms, from a net 21%). Likewise, a net 3% of firms indicated that the impact of their firm-specific outlook, in terms of sales and profits, on the availability of external financing was worsening (down from 11% in the previous survey round). While SMEs continued to perceive a deterioration in the impact of their specific economic outlook (a net ‑6%), large firms reported some signs of improvement (a net 1%). Firms continued to signal an improvement in the impact of their own capital position (a net 7%, from a net 8% in the previous quarter) and creditworthiness on the availability of external financing (a net 14%, from a net 13% in the previous quarter) (Chart 8). Firms also reported a similar overall sentiment as regards the factors affecting the availability of external finance over the past six months.
Chart 7
Changes in factors that have an impact on the availability of external financing for euro area firms (general economic outlook, firm-specific outlook and firms’ own capital)
(net percentages of respondents)
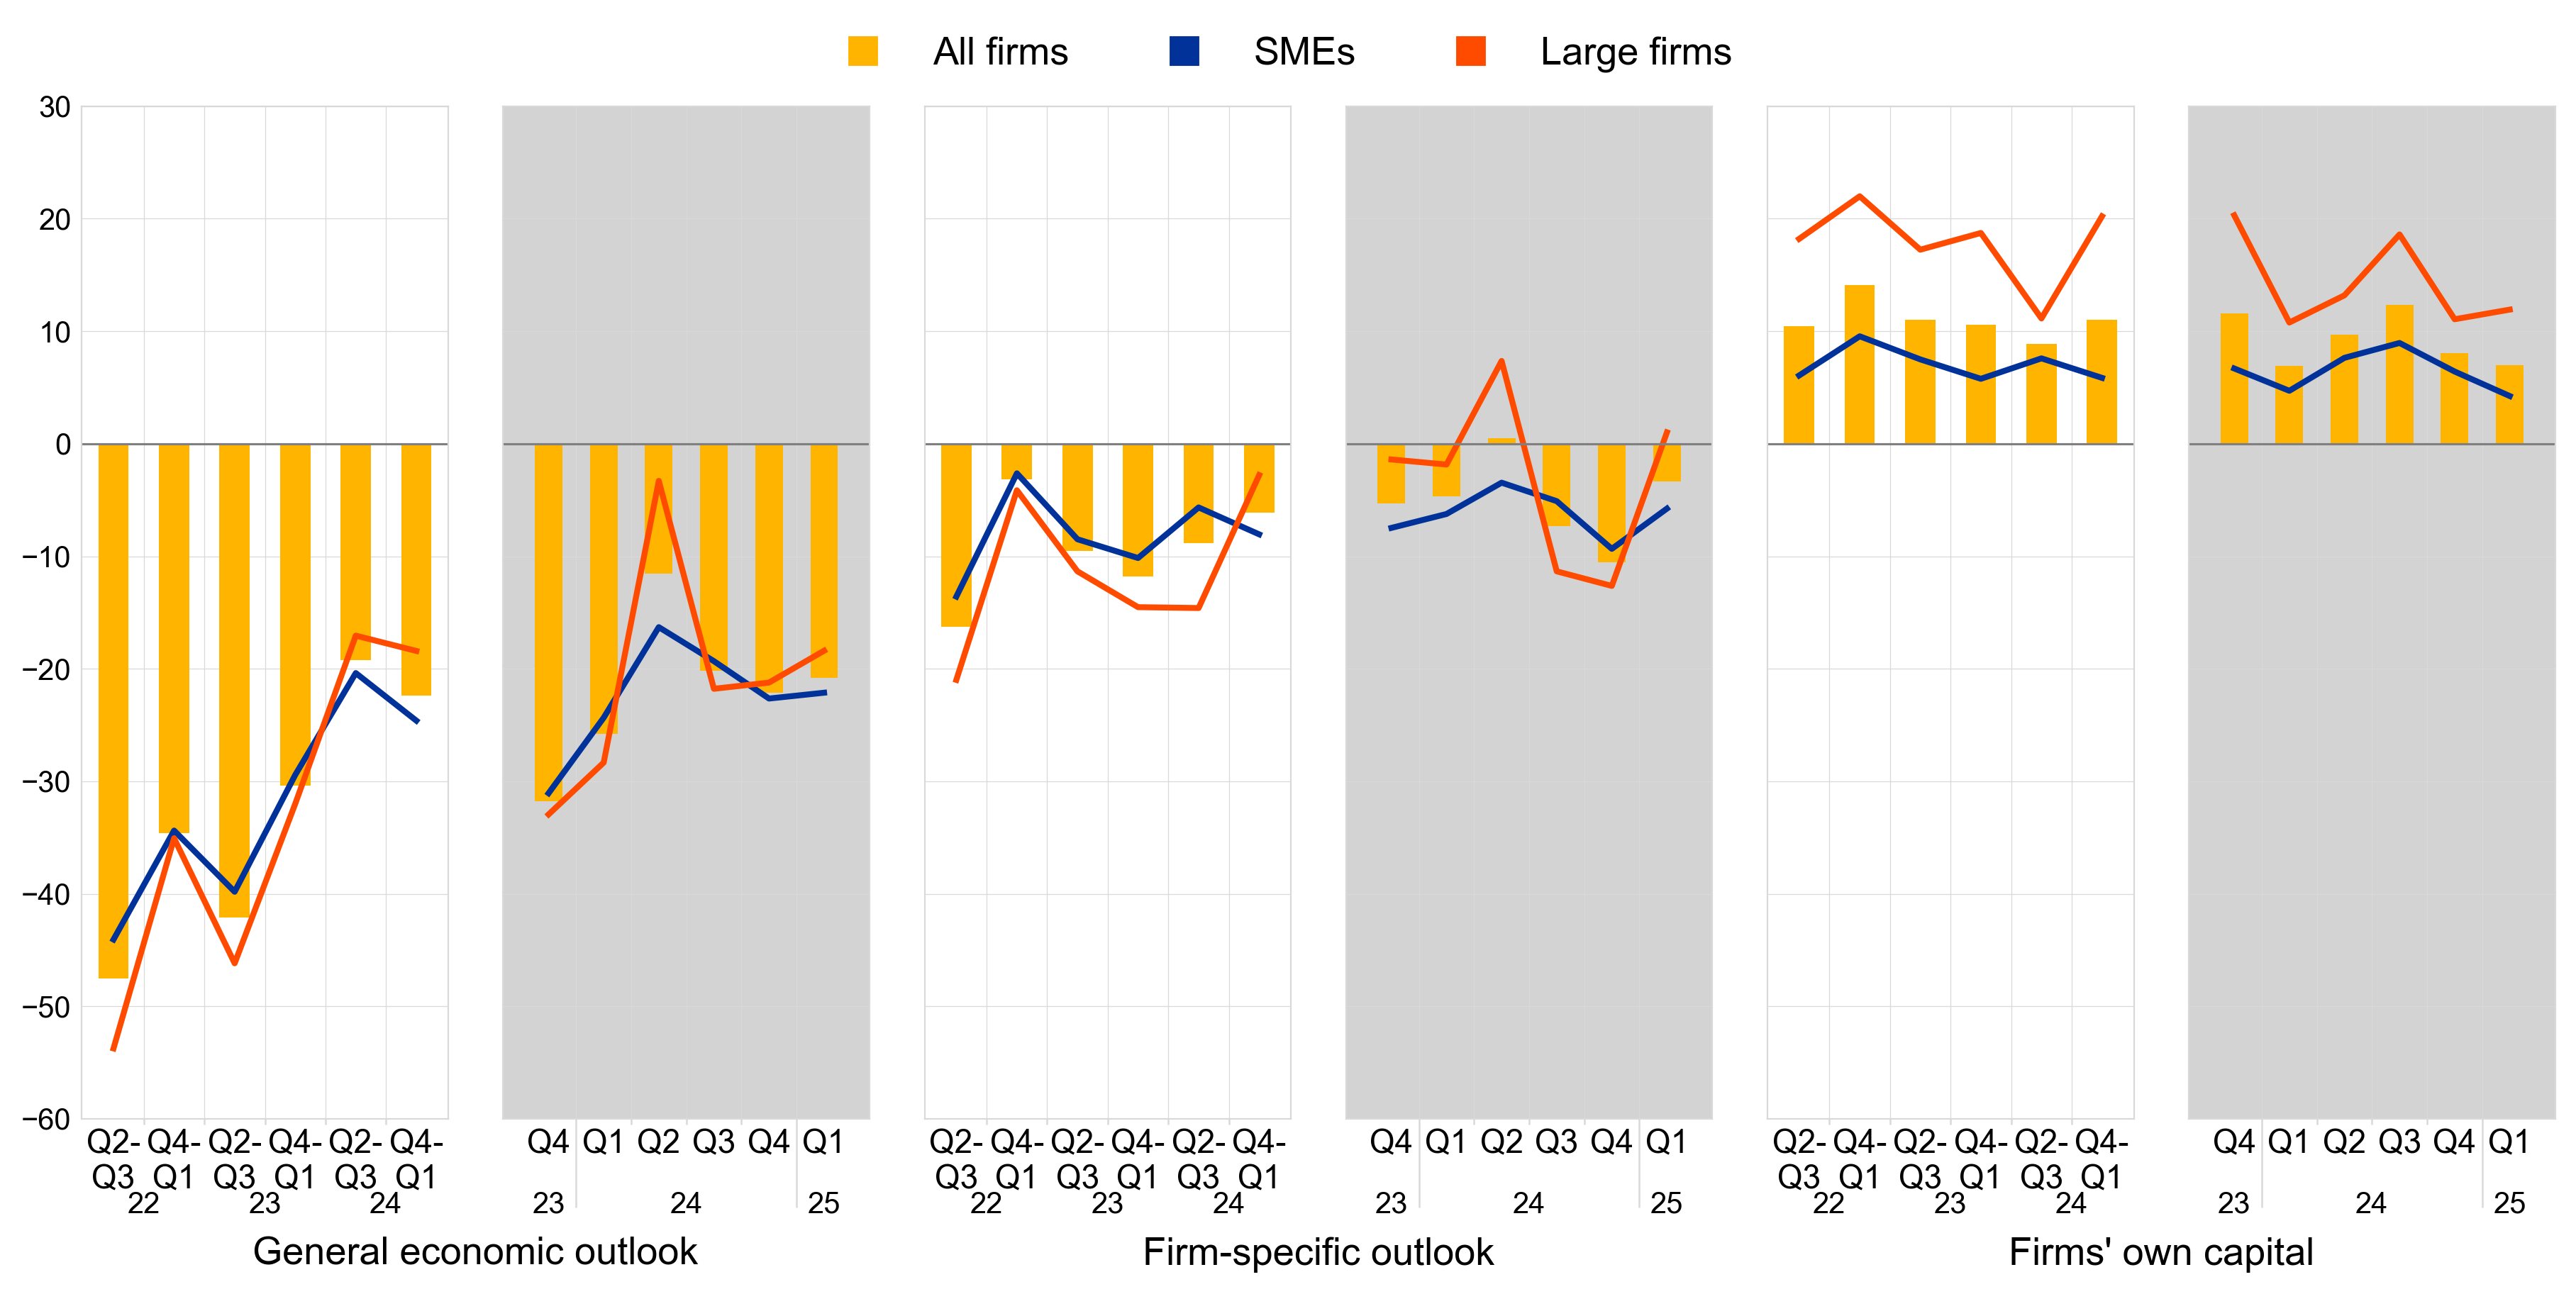
Base: All firms. The figures refer to rounds 27 to 34 of the survey (April-September 2022 to October 2024-March 2025).
Notes: See the notes to Chart 1. The data included in the chart refer to Question 11 of the survey. The grey panels represent responses to the same question for three-monthly reference periods, whereas the white panels relate to six-monthly reference periods.
Firms continued to report an increase in banks' willingness to lend, although it was slightly less than in the previous survey (Chart 8). On balance, 7% of firms reported an improvement in banks’ willingness to lend, from 8% in the previous survey round. A net 5% of SMEs reported an improvement in banks’ attitudes towards them, whereas the figure was a net 11% for large firms. Firms also signalled that business partners were more willing to provide trade credit (a net 7%, from a net 4% in the previous survey round). In the current survey round, large firms reported a relatively significant improvement in their perception of the willingness of their trading partners to provide credit (a net 7%, compared with a net 1% reporting decreasing willingness in the previous quarter). Among the sample of firms reporting on the past six months, the increase in the reported willingness of banks to provide credit was predominantly due to the more positive perceptions of large firms.
Chart 8
Changes in factors that have an impact on the availability of external financing for euro area firms (firm’s credit history, willingness of banks to lend and willingness of suppliers to provide trade credit)
(net percentages of respondents)
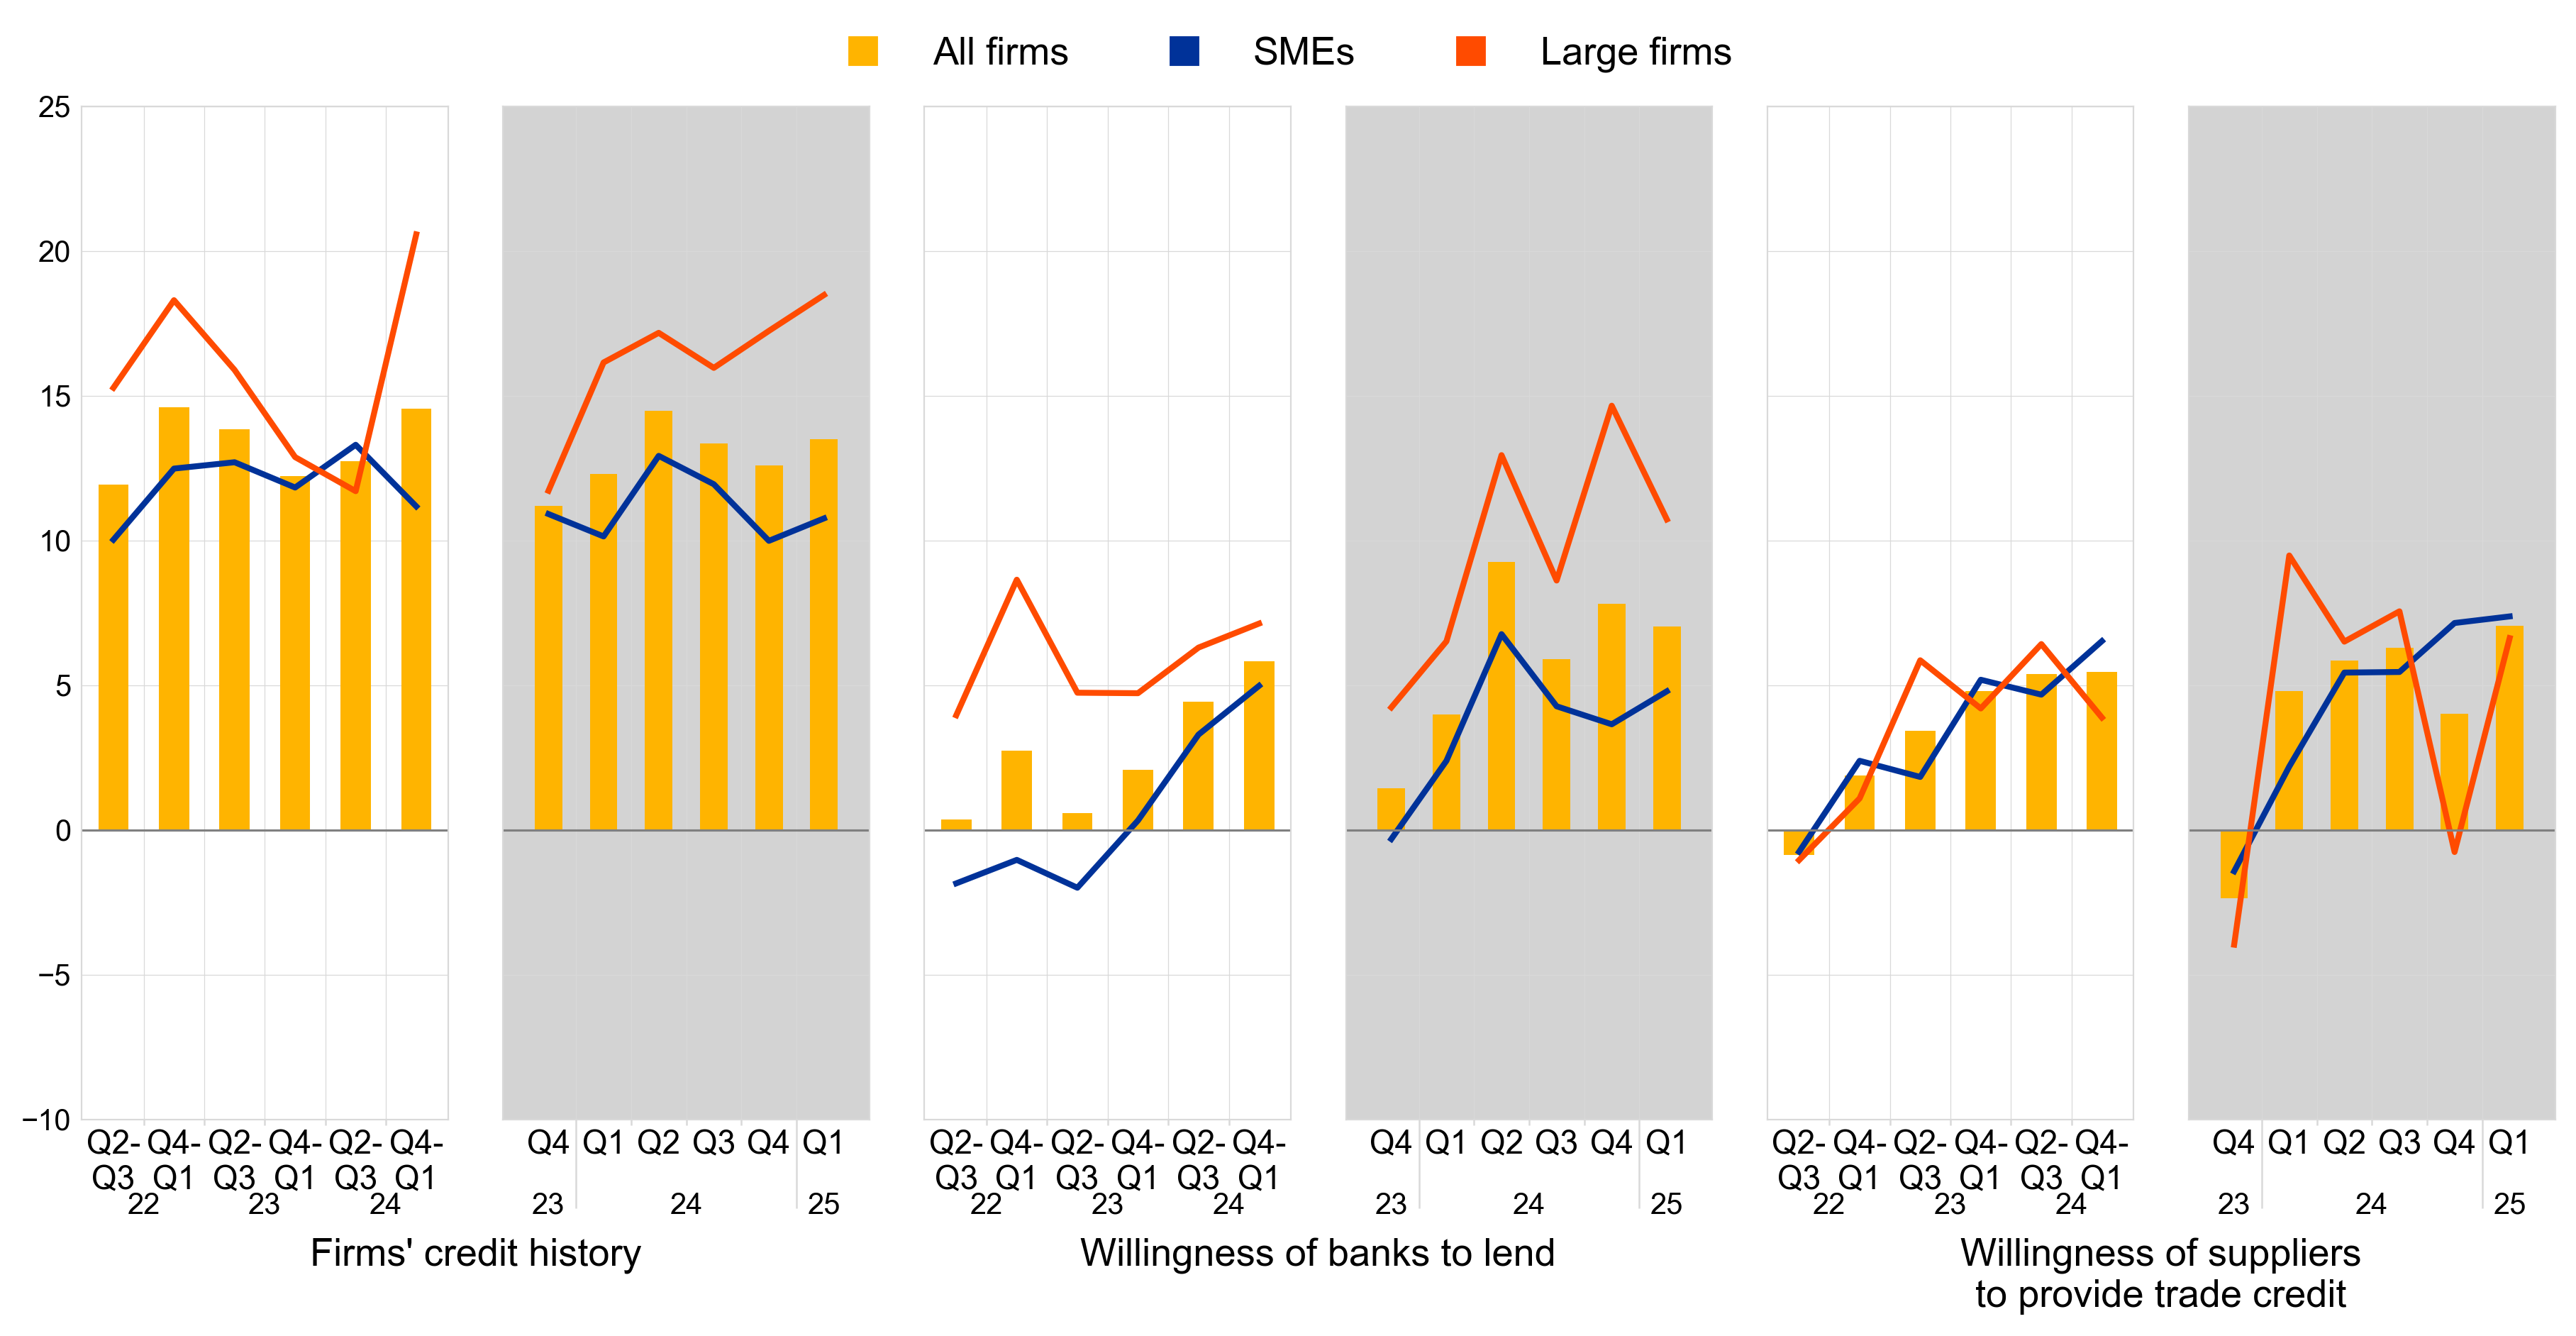
Base: All firms; for the category “willingness of banks to lend”, firms for which at least one bank financing instrument (credit line, bank overdraft, credit card overdraft, bank loan or subsidised bank loan) is relevant. The figures refer to rounds 27 to 34 of the survey (April-September 2022 to October 2024-March 2025).
Notes: See the notes to Chart 1. The data included in the chart refer to Question 11 of the survey. The grey panels represent responses to the same question for three-monthly reference periods, whereas the white panels relate to six-monthly reference periods.
2.6 Few firms applied for bank loans, with a small reduction in overall financing obstacles
A low share of firms continued to report applications for bank loans, but the percentage rose compared with the previous survey round (Chart 9). In the first quarter of 2025, the share of bank loan applications rose to 19%, 2 percentage points higher than in the previous quarter. This increase was observed across all firms, with SMEs at 16% and large firms at 25%. Additionally, fewer firms felt discouraged from applying for bank loans, with only 3% stating that this was the case, from 4% in the previous quarter. The most common reason firms gave for not applying was having sufficient internal funds to finance their business plans (52%from 53% in the previous quarter). This picture was consistent across size classes. When reporting on developments over the previous six months, one-quarter of firms indicated that they had applied for bank loans, the percentage standing at 35% for large firms and 18% for SMEs.
Chart 9
Applications for bank loans by euro area firms
(percentages of respondents)

Base: Firms for which bank loans (including subsided bank loans) are relevant. The figures refer to rounds 27 to 34 of the survey (April-September 2022 to October 2024-March 2025).
Notes: The data included in the chart refer to Question 7A of the survey. The grey panels represent responses to the same question for three-monthly reference periods, whereas the white panels relate to six-monthly reference periods.
The percentage of firms reporting obstacles to obtaining a bank loan remained low and declined slightly (Chart 10). Among firms that considered bank loans relevant for their enterprise, 5% – a decrease of one percentage point from the previous quarter – faced obstacles when seeking to obtain a loan. This trend was consistent across different size categories and across the various components of the indicator, such as high costs, limited amounts received, loan application rejections and discouragement from applying. Discouraged borrowers, i.e. firms that did not apply for bank loans even if they needed them, continued to represent the largest portion of firms facing financing obstacles. They accounted for 3% of all firms responding over the past three months and 4% for those responding over the past six months.
Chart 10
Obstacles to obtaining a bank loan
(percentages of respondents)

Base: Firms for which bank loans (including subsidised bank loans) are relevant. The figures refer to rounds 27 to 34 of the survey (April-September 2022 to October 2024-March 2025).
Notes: Financing obstacles are defined here as the total of the percentages of firms reporting (i) loan applications that resulted in an offer that was declined by the enterprise because the borrowing costs were too high, (ii) loan applications that were rejected, (iii) a decision not to apply for a loan for fear of rejection (discouraged borrowers), and (iv) loan applications for which only a limited amount was granted. The grey panels represent responses to the same question for three-monthly reference periods, whereas the white panels relate to six-monthly reference periods. The data included in the chart refer to Questions 7A and 7B of the survey.
3.1 Few firms reported increased turnover, while cost pressures are on the rise
Over the last three months, on balance, few enterprises continued to report an increase in turnover (Chart 11). A net 6% of euro area firms indicated higher turnover in the first quarter of 2025 (unchanged from the fourth quarter of 2024). Significant differences in the development of turnover persisted across size classes. Large firms continued to report a significant improvement (a net 20%, unchanged from the previous quarter). Conversely, SMEs indicated a decline, with a net decrease of 2% (unchanged from the previous quarter). Looking ahead, firms are very optimistic about future turnover, more so than in the previous quarter (a net 30%, up from a net 11%), with a net 24% of SMEs and a net 41% of large firms expecting an increase in the next quarter (from 6% and 19% respectively in net terms). Similar developments in turnover were reported by firms replying on the past six months. Firms, and in particular large firms, remained optimistic about their turnover also for the next six months, with a net 28% (up from a net 19% in the third quarter of 2024) expecting increases.
Slightly more firms continued to signal a deterioration in profits in the first quarter of 2025 compared with the previous quarter. On balance, a slightly larger percentage of euro area firms reported a decline in profits, (a net ‑16%, compared with a net ‑14% in the fourth quarter of 2024). The decline was more widespread among SMEs, with a net 18% reporting a decrease in profits (following net -17% in the previous quarter), compared with a net 11% of large firms reporting a deterioration (following a net -9%).
More firms reported increasing cost pressures, including for materials, energy, and labour costs. A net 60% of firms indicated an increase in labour costs in the first quarter of 2025 (up from 47% in the fourth quarter of 2024). Similarly, the net percentage of firms experiencing rising material and energy costs increased to 59% from 47% in the previous quarter. Both large firms and SMEs reported labour and material and energy cost increases, with the net percentages of firms indicating an increase larger for SMEs than for large firms. Results covering the past six months confirm rising costs pressures for firms.
Compared to all other production-related costs, on net, a low share of firms reported increasing interest expenses. A net, 8% of firms reported higher interest expenses, following 7% in the previous quarter. Across size classes, a net 9% of SMEs had seen a rise in expenses, compared with 6% for large firms. Results covering the past six months show, on net, that a lower share of firms indicated rising interest expenses relative to the period covering the second and third quarters of 2024.
Chart 11
Changes in the economic situation of euro area firms
(net percentages of respondents)

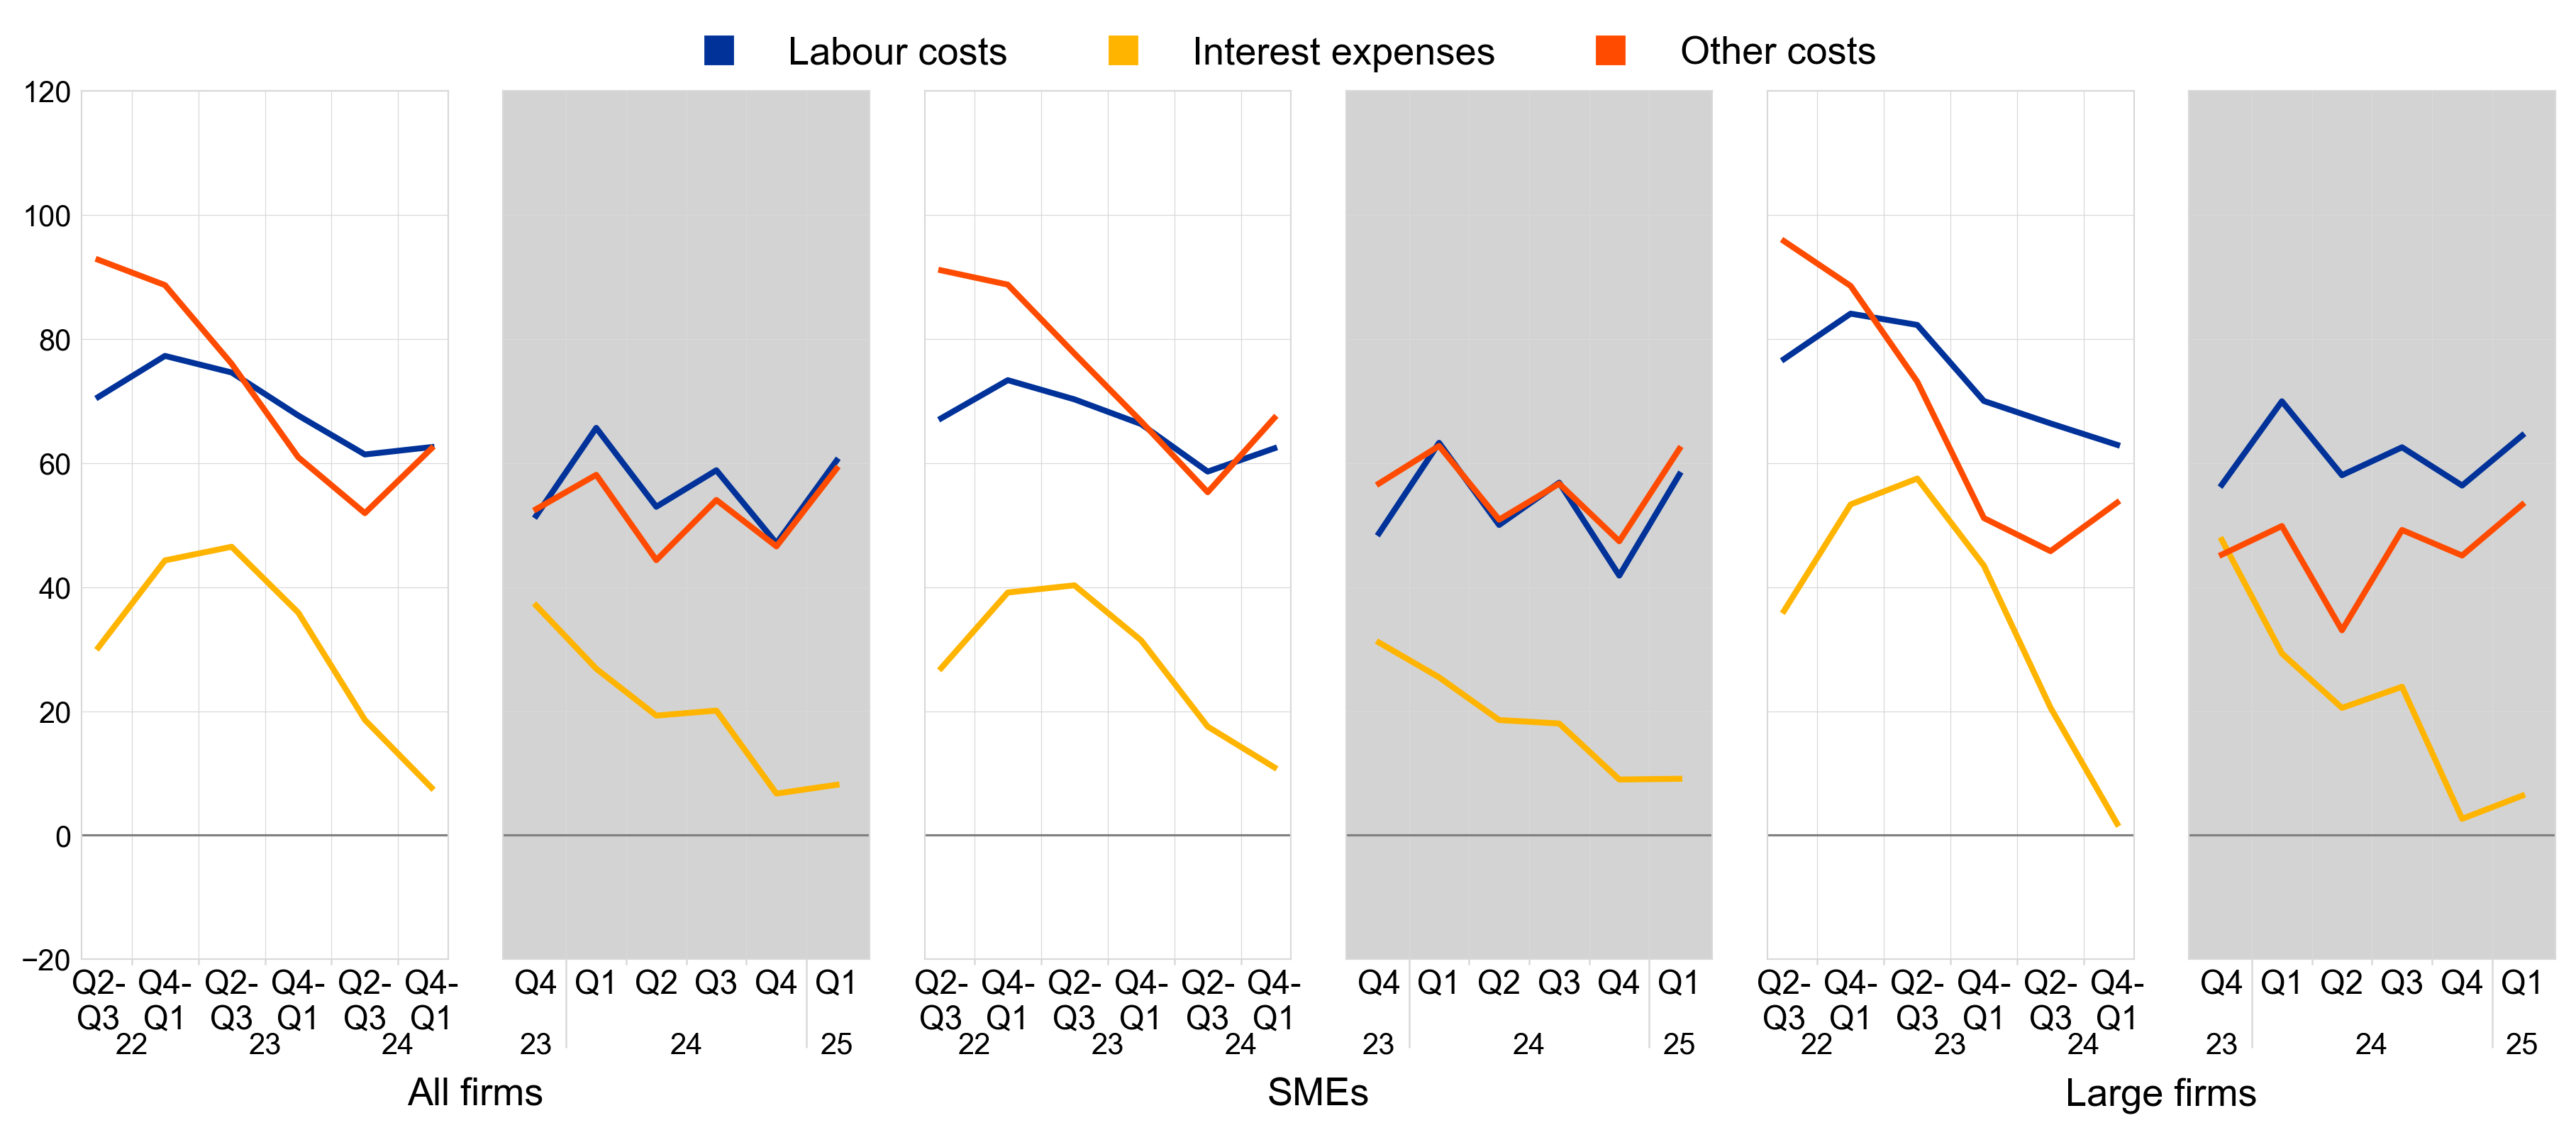
Base: All firms. The figures refer to rounds 27 to 34 of the survey (April-September 2022 to October 2024-March 2025).
Notes: See the notes to Chart 1. The data included in the chart refer to Question 2 of the survey.
Over the past three months, the share of financially vulnerable enterprises was low and similar to the previous quarter (Chart 12). The financial vulnerability indicator, which offers a comprehensive evaluation of firms’ financial health, shows that only 4% of euro area firms experienced significant difficulties in managing their businesses and servicing their debts during this period (unchanged from the previous quarter).[4] Among SMEs, 5% of firms were vulnerable, as compared with 3% for large firms. Over the same quarter, the proportion of financially resilient firms – those better equipped to withstand adverse shocks – increased slightly to 5%, with a slightly higher share of large firms than SMEs falling into this category. Developments over the past six months were similar.
Chart 12
Vulnerable and financially resilient firms in the euro area
a) Vulnerable firms
(percentages of respondents)
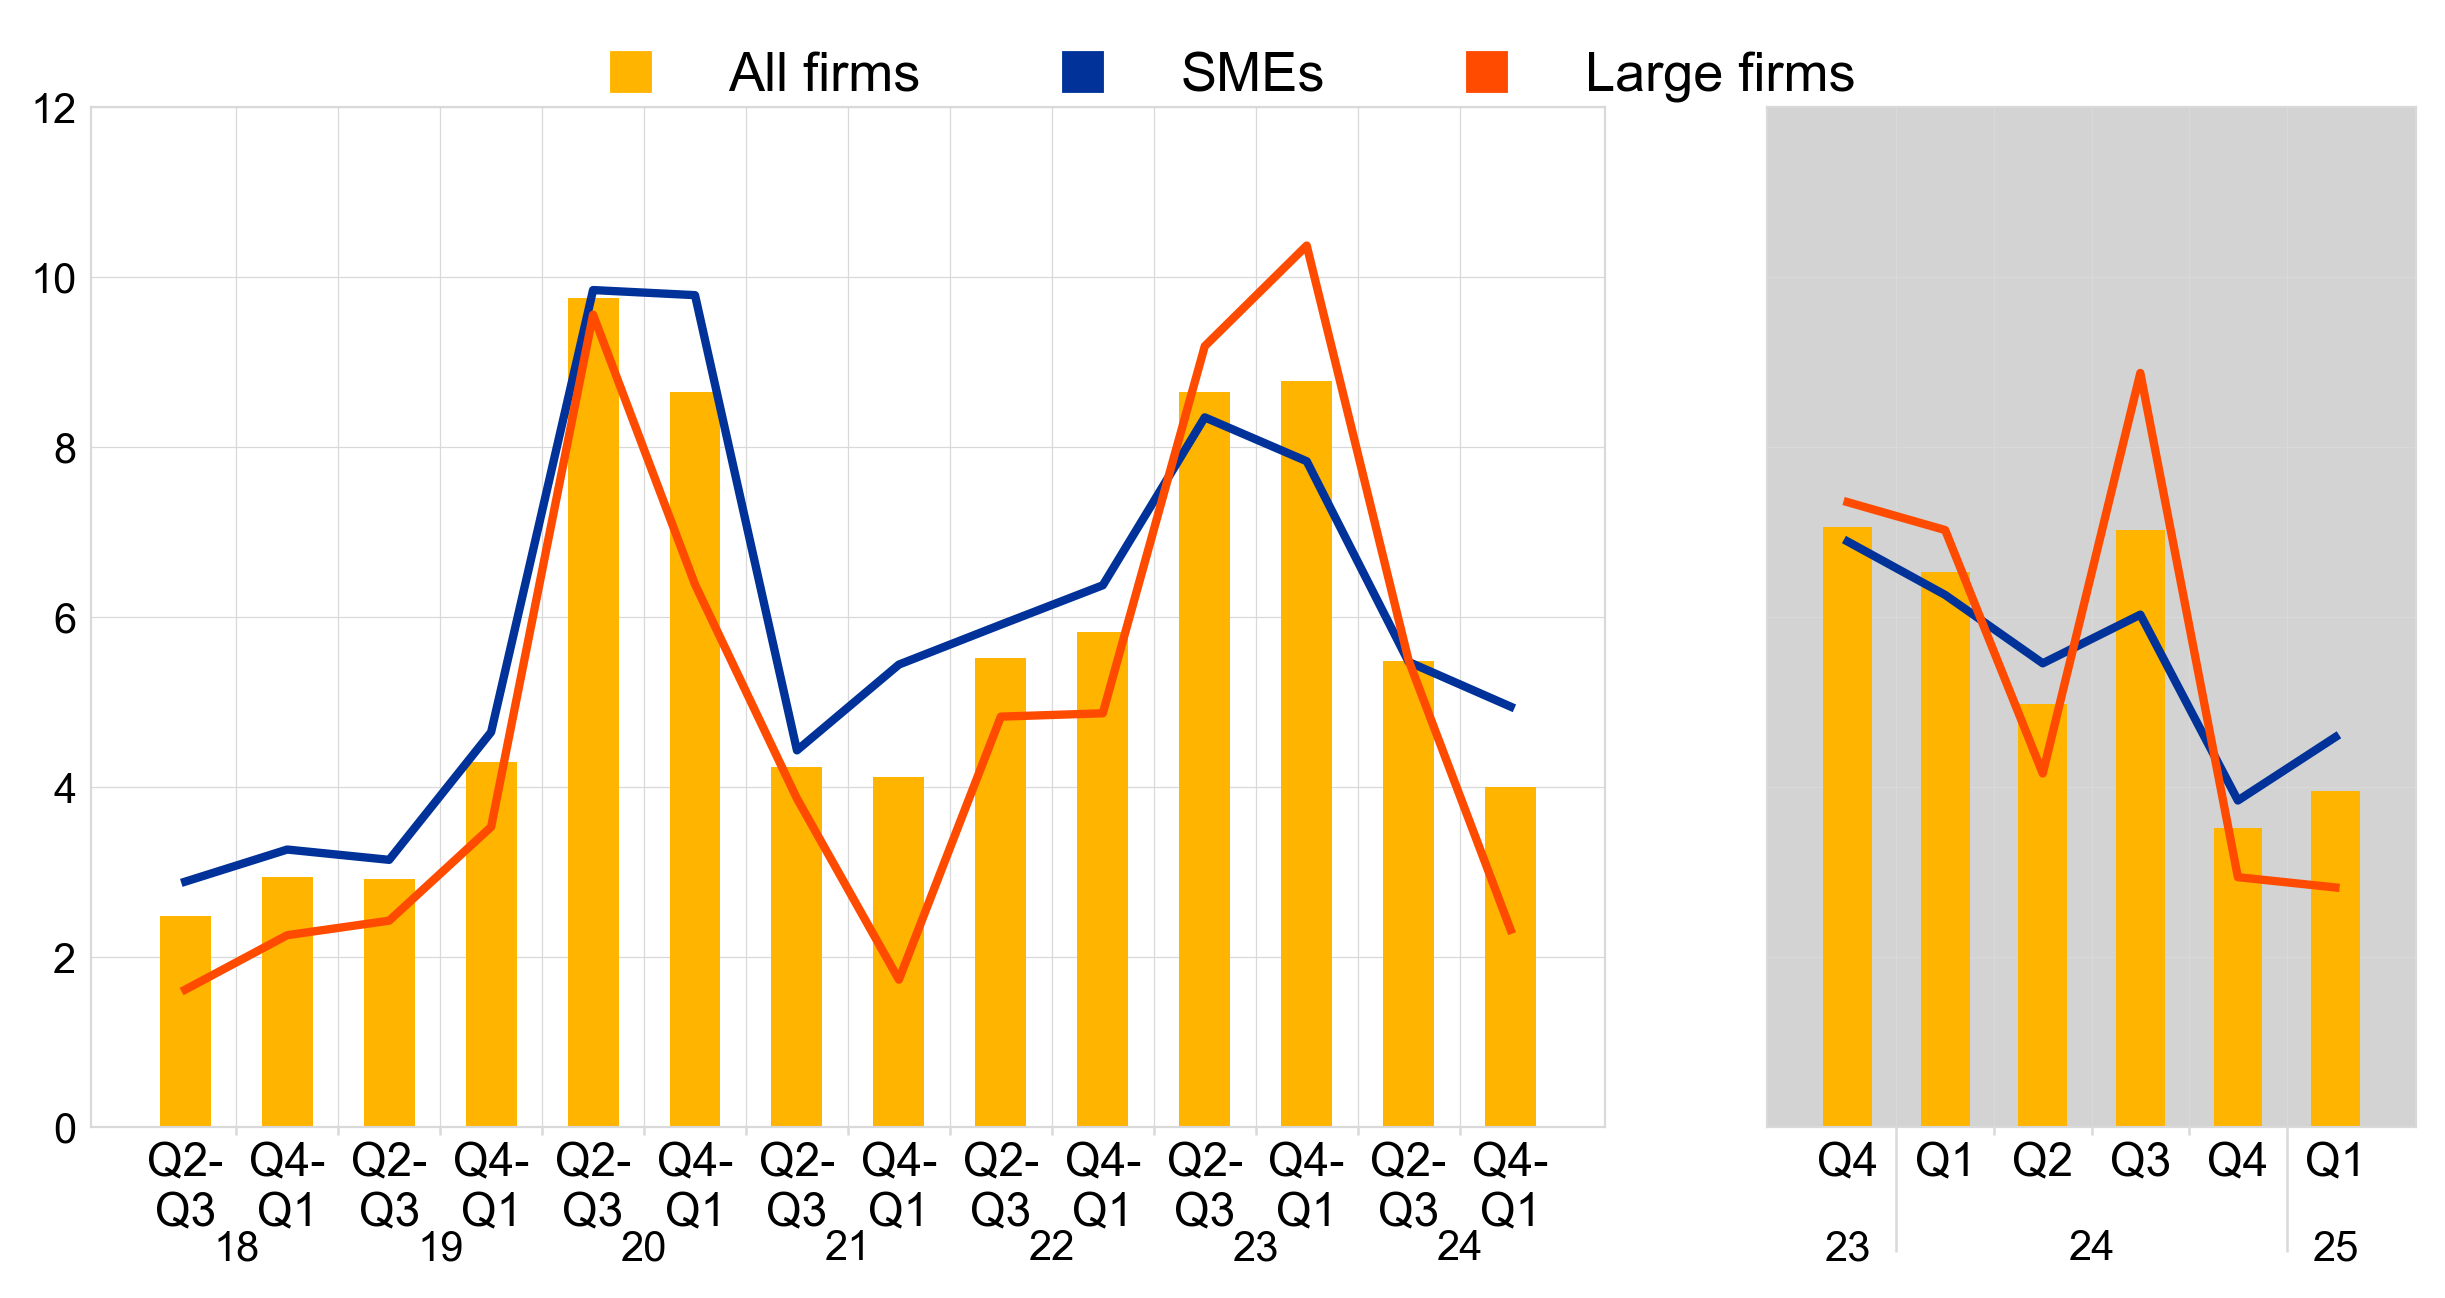
b) Financially resilient firms
(percentages of respondents)
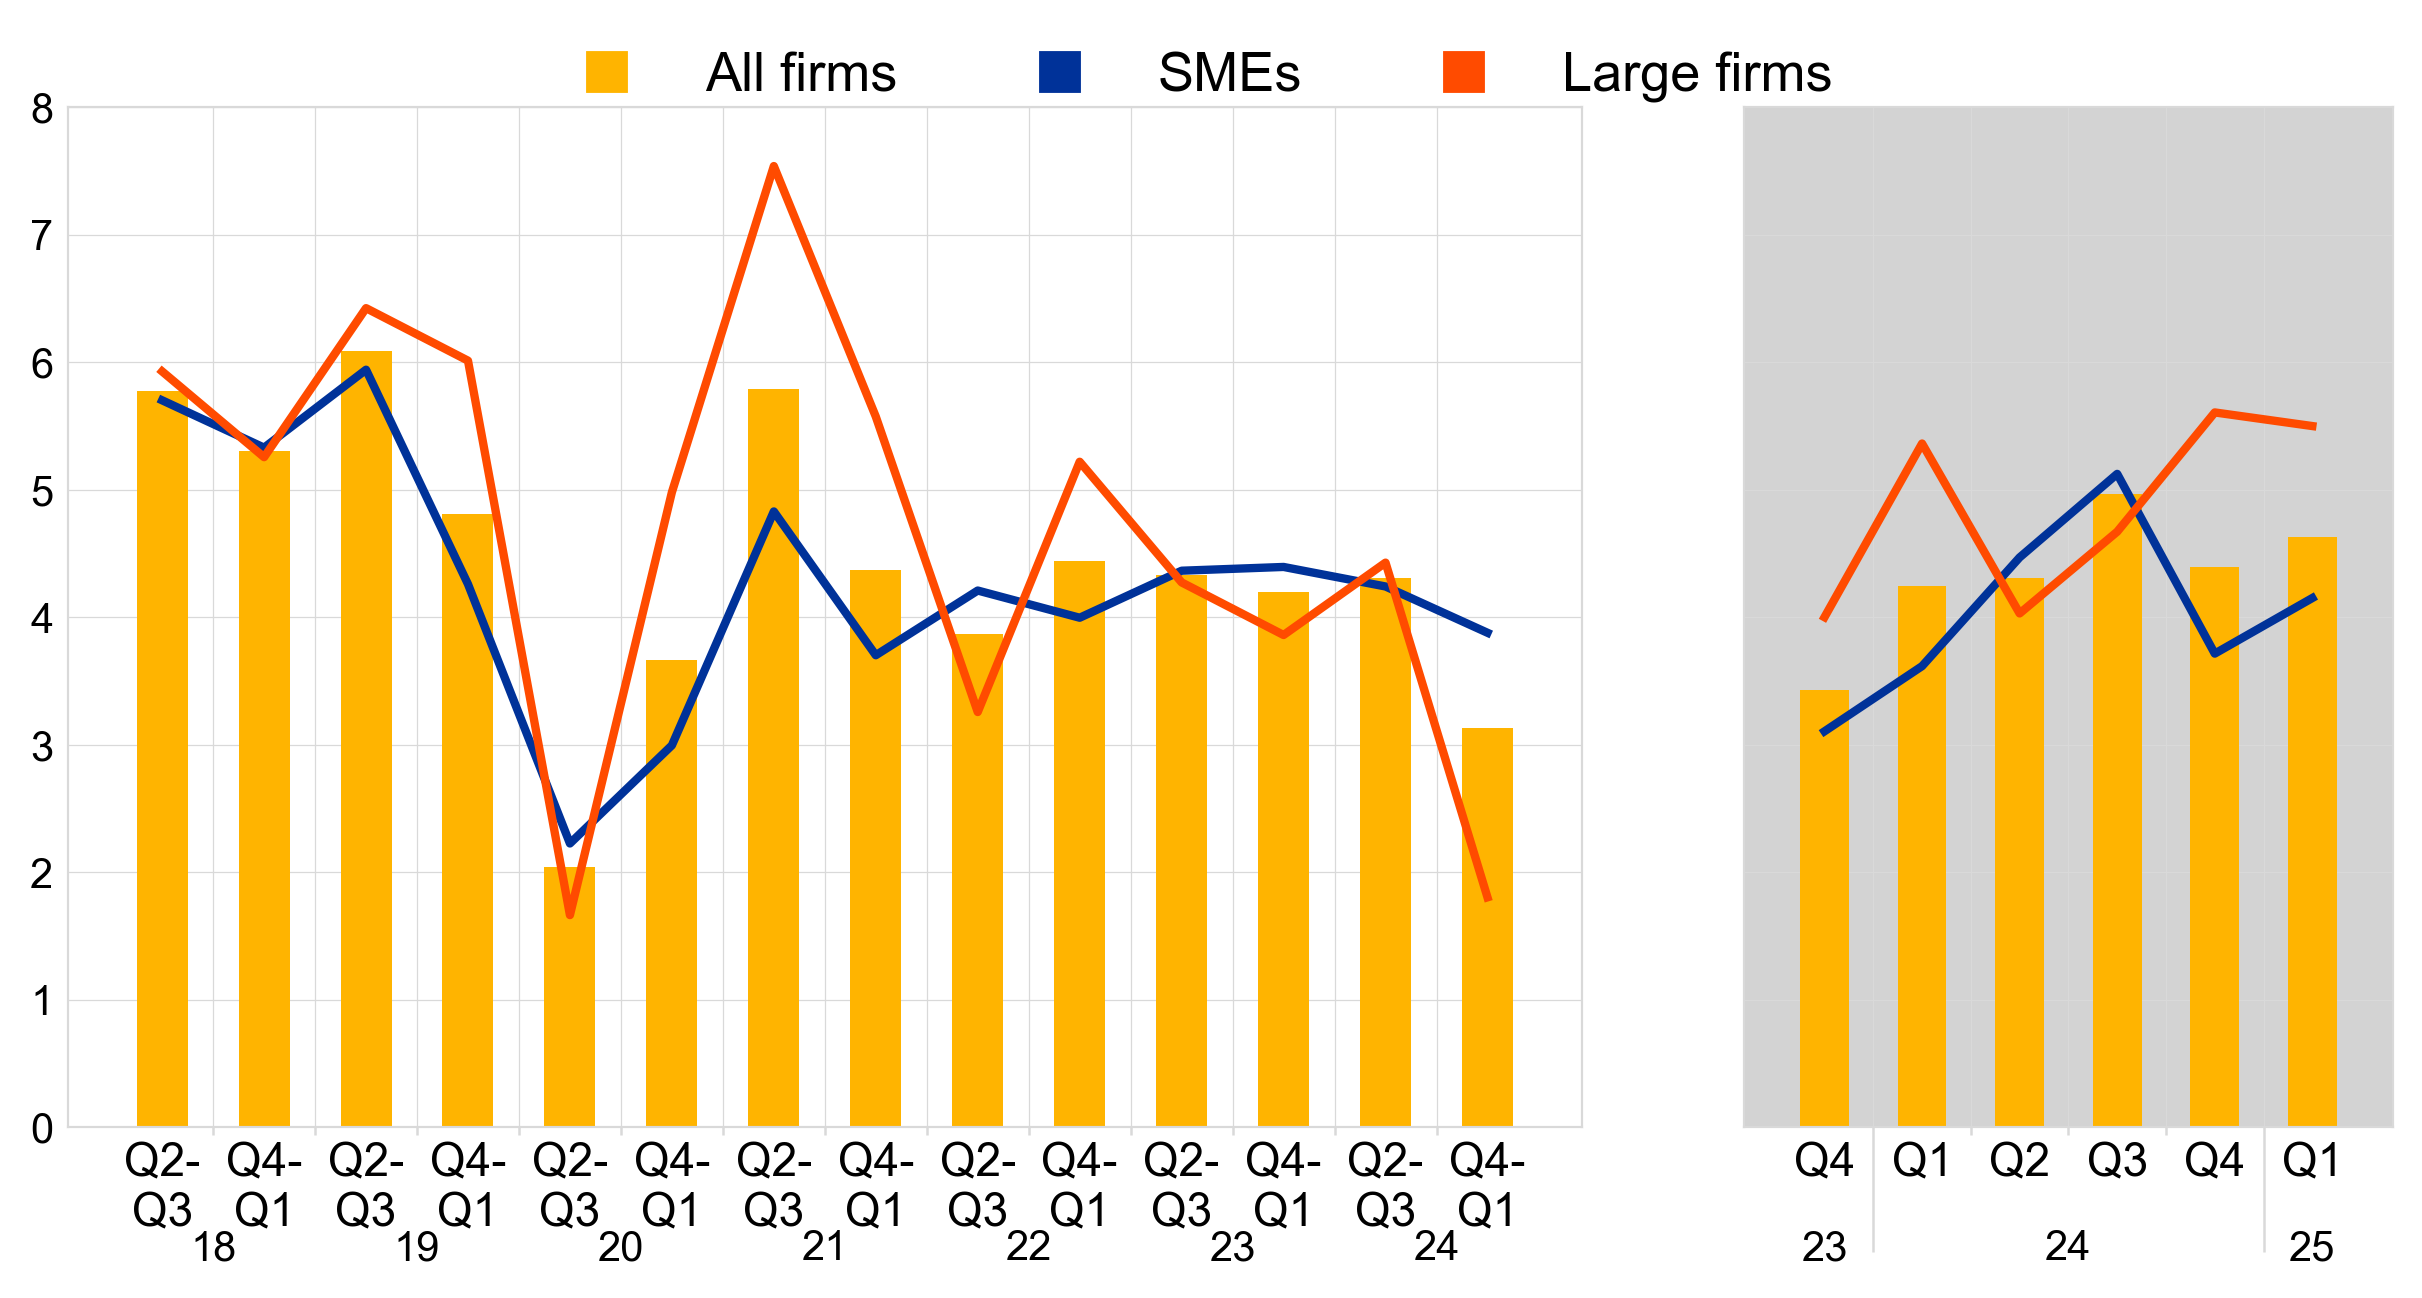
Base: All enterprises. The figures refer to rounds 19 to 34 of the survey (April-September 2018 to October 2024-March 2025).
Notes: For a definition of “vulnerable firms” and “resilient firms”, see footnote 4. The data included in the chart refer to Question 2 of the survey. The grey panels represent responses to the same question for three-monthly reference periods, whereas the white panels relate to six-monthly reference periods.
3.2 Investment activity remained subdued, with improvement expected in the second quarter of 2025
Few enterprises reported an increase in investment over the past three months (Chart 13). A net 5% of firms indicated a rise in investment in the first quarter of 2025 (after a net 4% in the previous quarter). For SMEs, the net percentage of firms reporting an increase in investment was slightly lower than in the previous quarter (a net 3%, following a net 4% in the fourth quarter of 2024), whereas for large firms, the net percentage indicating an increase in investment was higher than in the previous quarter (a net 9%, up from 4% in the previous quarter). Looking ahead, firms, and in particular large firms, are optimistic about investment. A net 11% of firms expect an increase in investment in the second quarter of 2025. Across size classes, 5% of SMEs and 22% of large firms expect investment to strengthen in the second quarter of 2025.
Chart 13
Changes in realised and expected fixed investments of euro area enterprises
(net percentages of respondents)
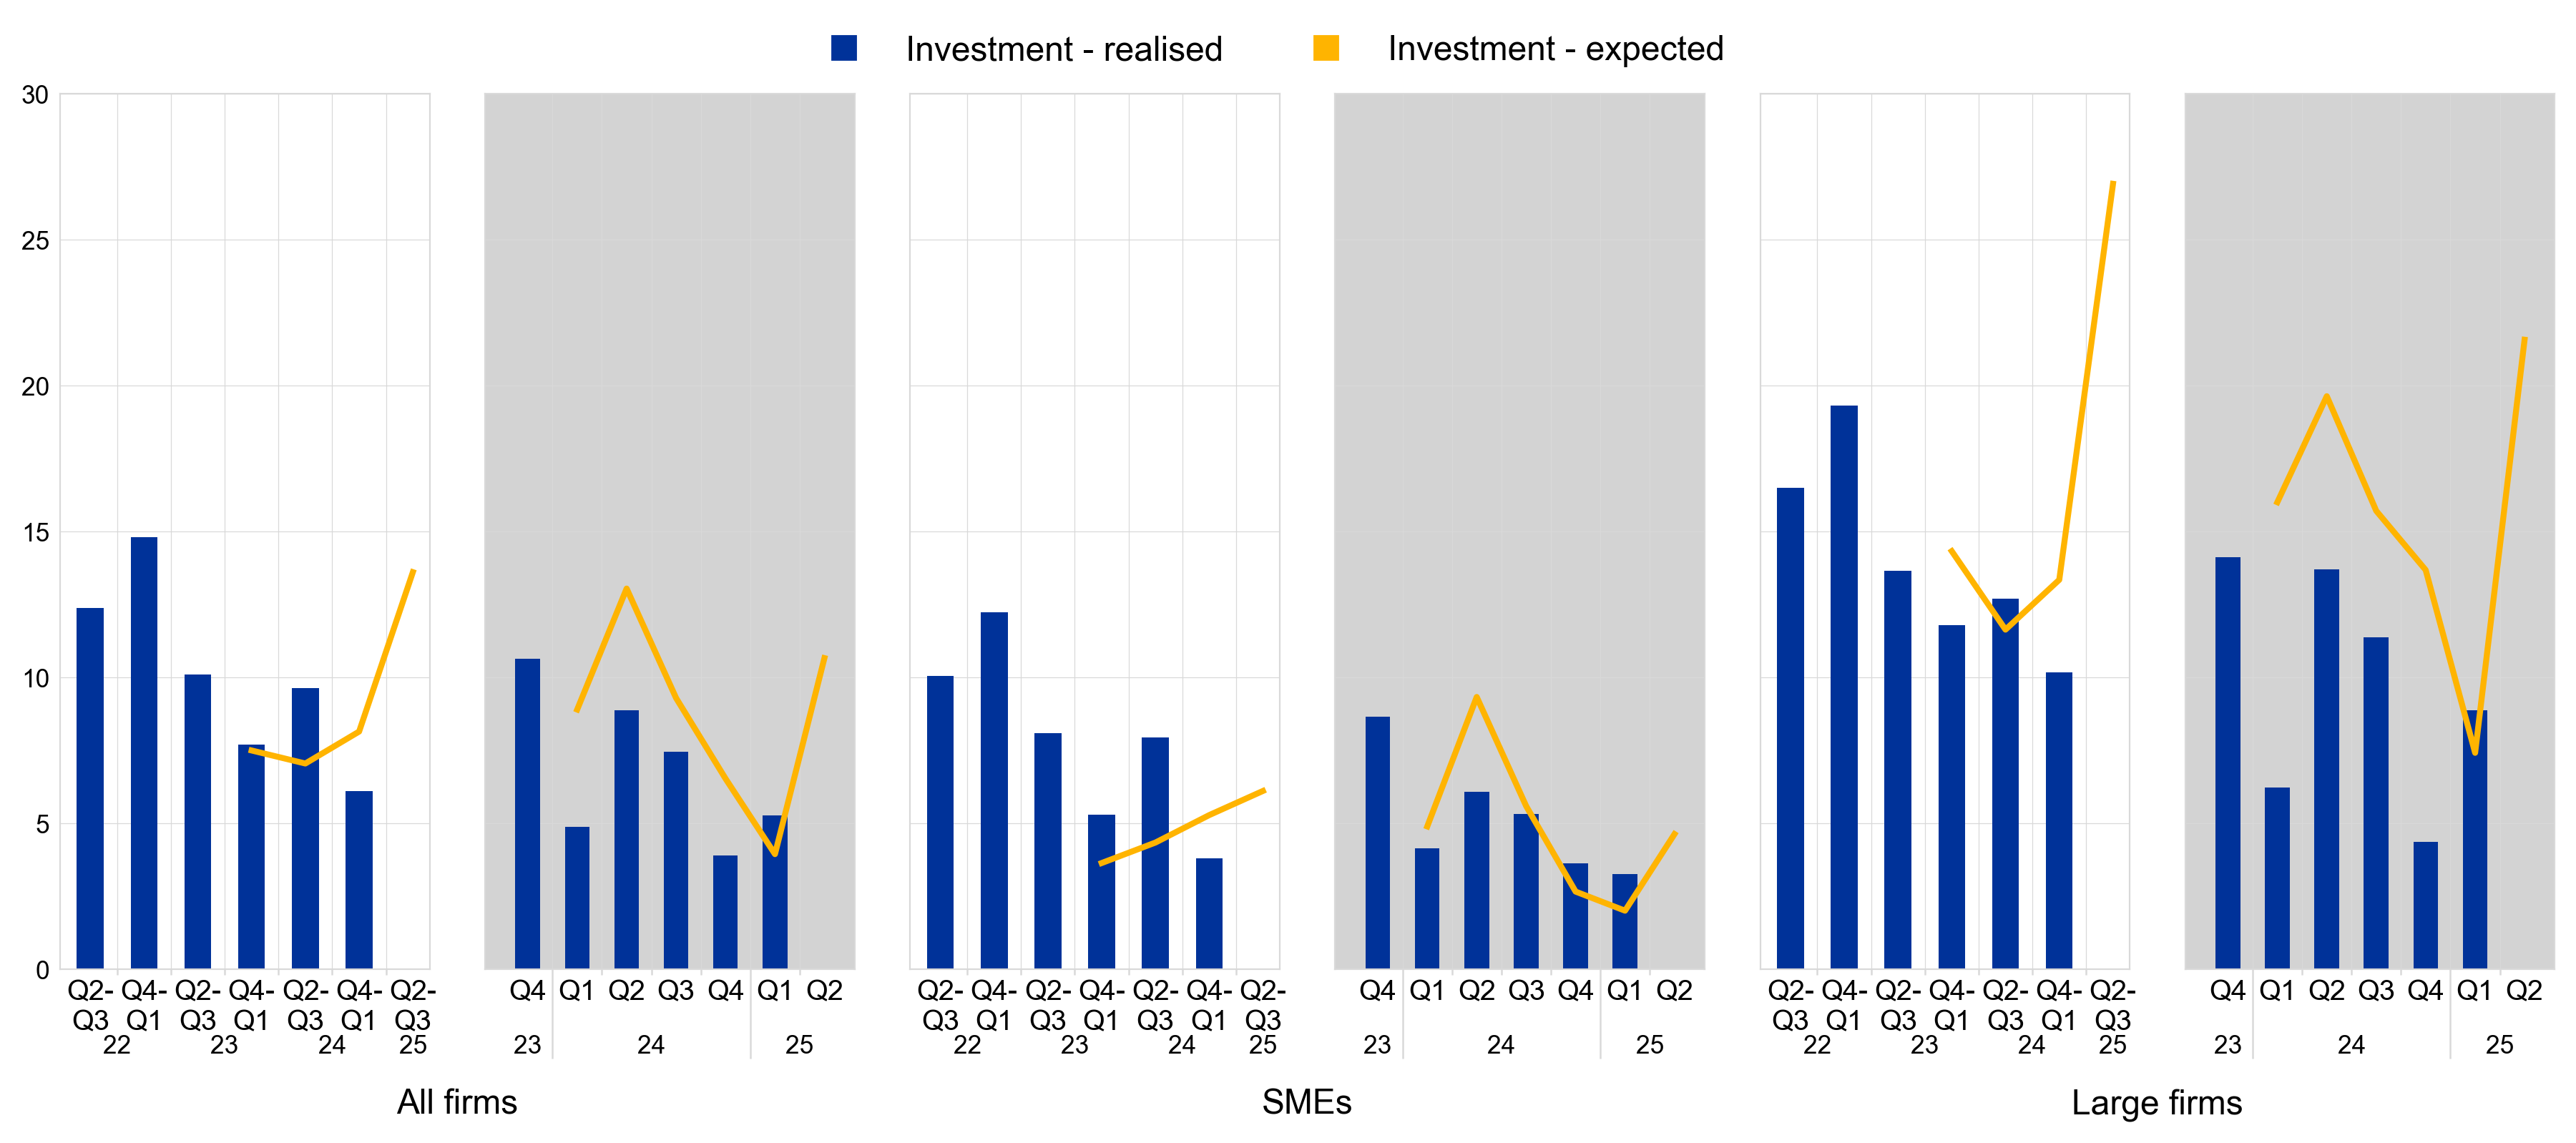
Base: All firms. The figures refer to rounds 27 to 34 of the survey (April-September 2022 to October 2024-March 2025).
Notes: See the notes to Chart 1. Bars refer to developments over the preceding six months and lines to expectations over the next six months. The data included in the chart refer to Questions 2 and 26 of the survey. The expected investment line is shifted forward by one period to allow for direct comparison with realisations. The question on expected investments was first included in the questionnaire covering the second and third quarters of 2023.The grey panels represent responses to the same question for three-monthly reference periods, whereas the white panels relate to six-monthly reference periods.
3.3 Euro area enterprises are becoming more concerned about regulation and cost of production
An increasing share of firms has indicated that regulation and production and labour costs are major concerns limiting production (Chart 14). Over the past six months, the availability of skilled labour remained the most widely reported major concern (defined as a score of at least seven on a scale of one to ten) among euro area firms (signalled by 63% of firms), alongside production or labour costs (63%, up from 61% in the previous period). In addition, the proportion of firms indicating that regulation (including industrial regulation) or finding customers is a major concern has also increased (up from 45% to 49% for regulation and from 52% to 54% for finding customers). These recent developments might be explained by trade policy uncertainty and the announcement of tariffs, which might affect, directly or indirectly, the production and the destination market of firms in the euro area.
A relatively low share of firms reported access to finance as a major concern for their businesses. Similarly to the previous period, around 26% of firms reported access to finance as a key issue for their businesses.
Chart 14
Major concerns limiting production faced by euro area firms
(over the preceding six months; percentages of respondents)
Base: All firms. The figures refer to rounds 7 to 34 of the survey (April-September 2012 to October 2024-March 2025).
Notes: A “major concern” is defined as a problem scoring at least 7 on a scale of 1 to 10. The data included in the chart refer to Question 0b of the survey.
3.4 Firms’ expectations regarding selling prices are stable while wage expectations continue to moderate
Firms’ expectations of selling price growth remain unchanged, while expected wage growth continue to decrease (Chart 15). Firms expect their selling prices to rise by 2.9%, on average, over the next 12 months, as in the previous survey round. The dispersion of selling price expectations remains stable, with almost one-third of firms in the survey still not expecting prices to increase over the next year.[5] Expectations for wage increases have dropped to 3.0%, on average, down from 3.3% in the previous survey round, driven by lower wage expectations in the services sector.
Chart 15
Expectations for selling prices, wages, input costs and employees one year ahead
(percentages changes over the next 12 months)
Base: All firms. The figures refer to rounds 29 to 34 (September 2023 to March 2025) of the survey, with firms’ replies collected in the last month of the respective survey waves.
Notes: Mean and median euro area firm expectations of changes in selling prices, wages of current employees, non-labour input costs and number of employees for the next 12 months, along with interquartile ranges, using survey weights. The statistics are computed after trimming the data at the country-specific 1st and 99th percentiles. The data included in the chart refer to Question 34 of the survey.
Firms have slightly higher expectations for the growth of their non-labour input costs over the next year (Chart 15). The expected average increase in non-labour input costs is at 4.0%, up on 3.8% in the previous survey round and reflecting moderate upward pressures in energy and materials costs. In the current survey round, the distribution of the expected average increase in non-labour input costs has the same dispersion as in the previous survey round.
On average, firms expect employment growth to increase by 1.3% over the next year, while the median firm expects zero growth (Chart 15). The average expected employment growth is slightly higher than in the previous round, in which it stood at 1.0%. This reflects the fact that the distribution of expected changes in staffing levels is skewed to the upside, with some firms expecting larger increases while most expect modest increases or no change.
Across firm sizes, SMEs continue to report higher expectations for selling prices, wages and non-labour input costs than large firms (Chart 16). On average, SMEs expect greater increases than large firms, both in their selling prices (3.2%, compared with 2.2% in the previous survey round) and in non-labour input costs (4.5%, compared with 3.0% in the previous survey round, both slightly higher). SME expectations for wage costs over the next year stand at 3.2%, slightly lower than the 3.4% in the previous survey round, while for large firms the figure have dropped to 2.7%, down from 3.2%. Employment growth expectations for the next 12 months have increased slightly for both SMEs and large firms (1.5% and 0.9% respectively, compared with 1.1% and 0.7% in last survey round).
Chart 16
Expectations for selling prices, wages, input costs and employees one year ahead, by size class
(percentage changes over the next 12 months)

Base: All firms. The figures refer to rounds 29 to 34 (September 2023 to March 2025) of the survey, with firms’ replies collected in the last month of the respective survey waves.
Notes: Weighted average euro area firm expectations of changes in selling prices, wages of current employees, non-labour input costs and number of employees for the next 12 months using survey weights. The statistics are computed after trimming the data at the country-specific 1st and 99th percentiles. The data included in the chart refer to Question 34 of the survey.
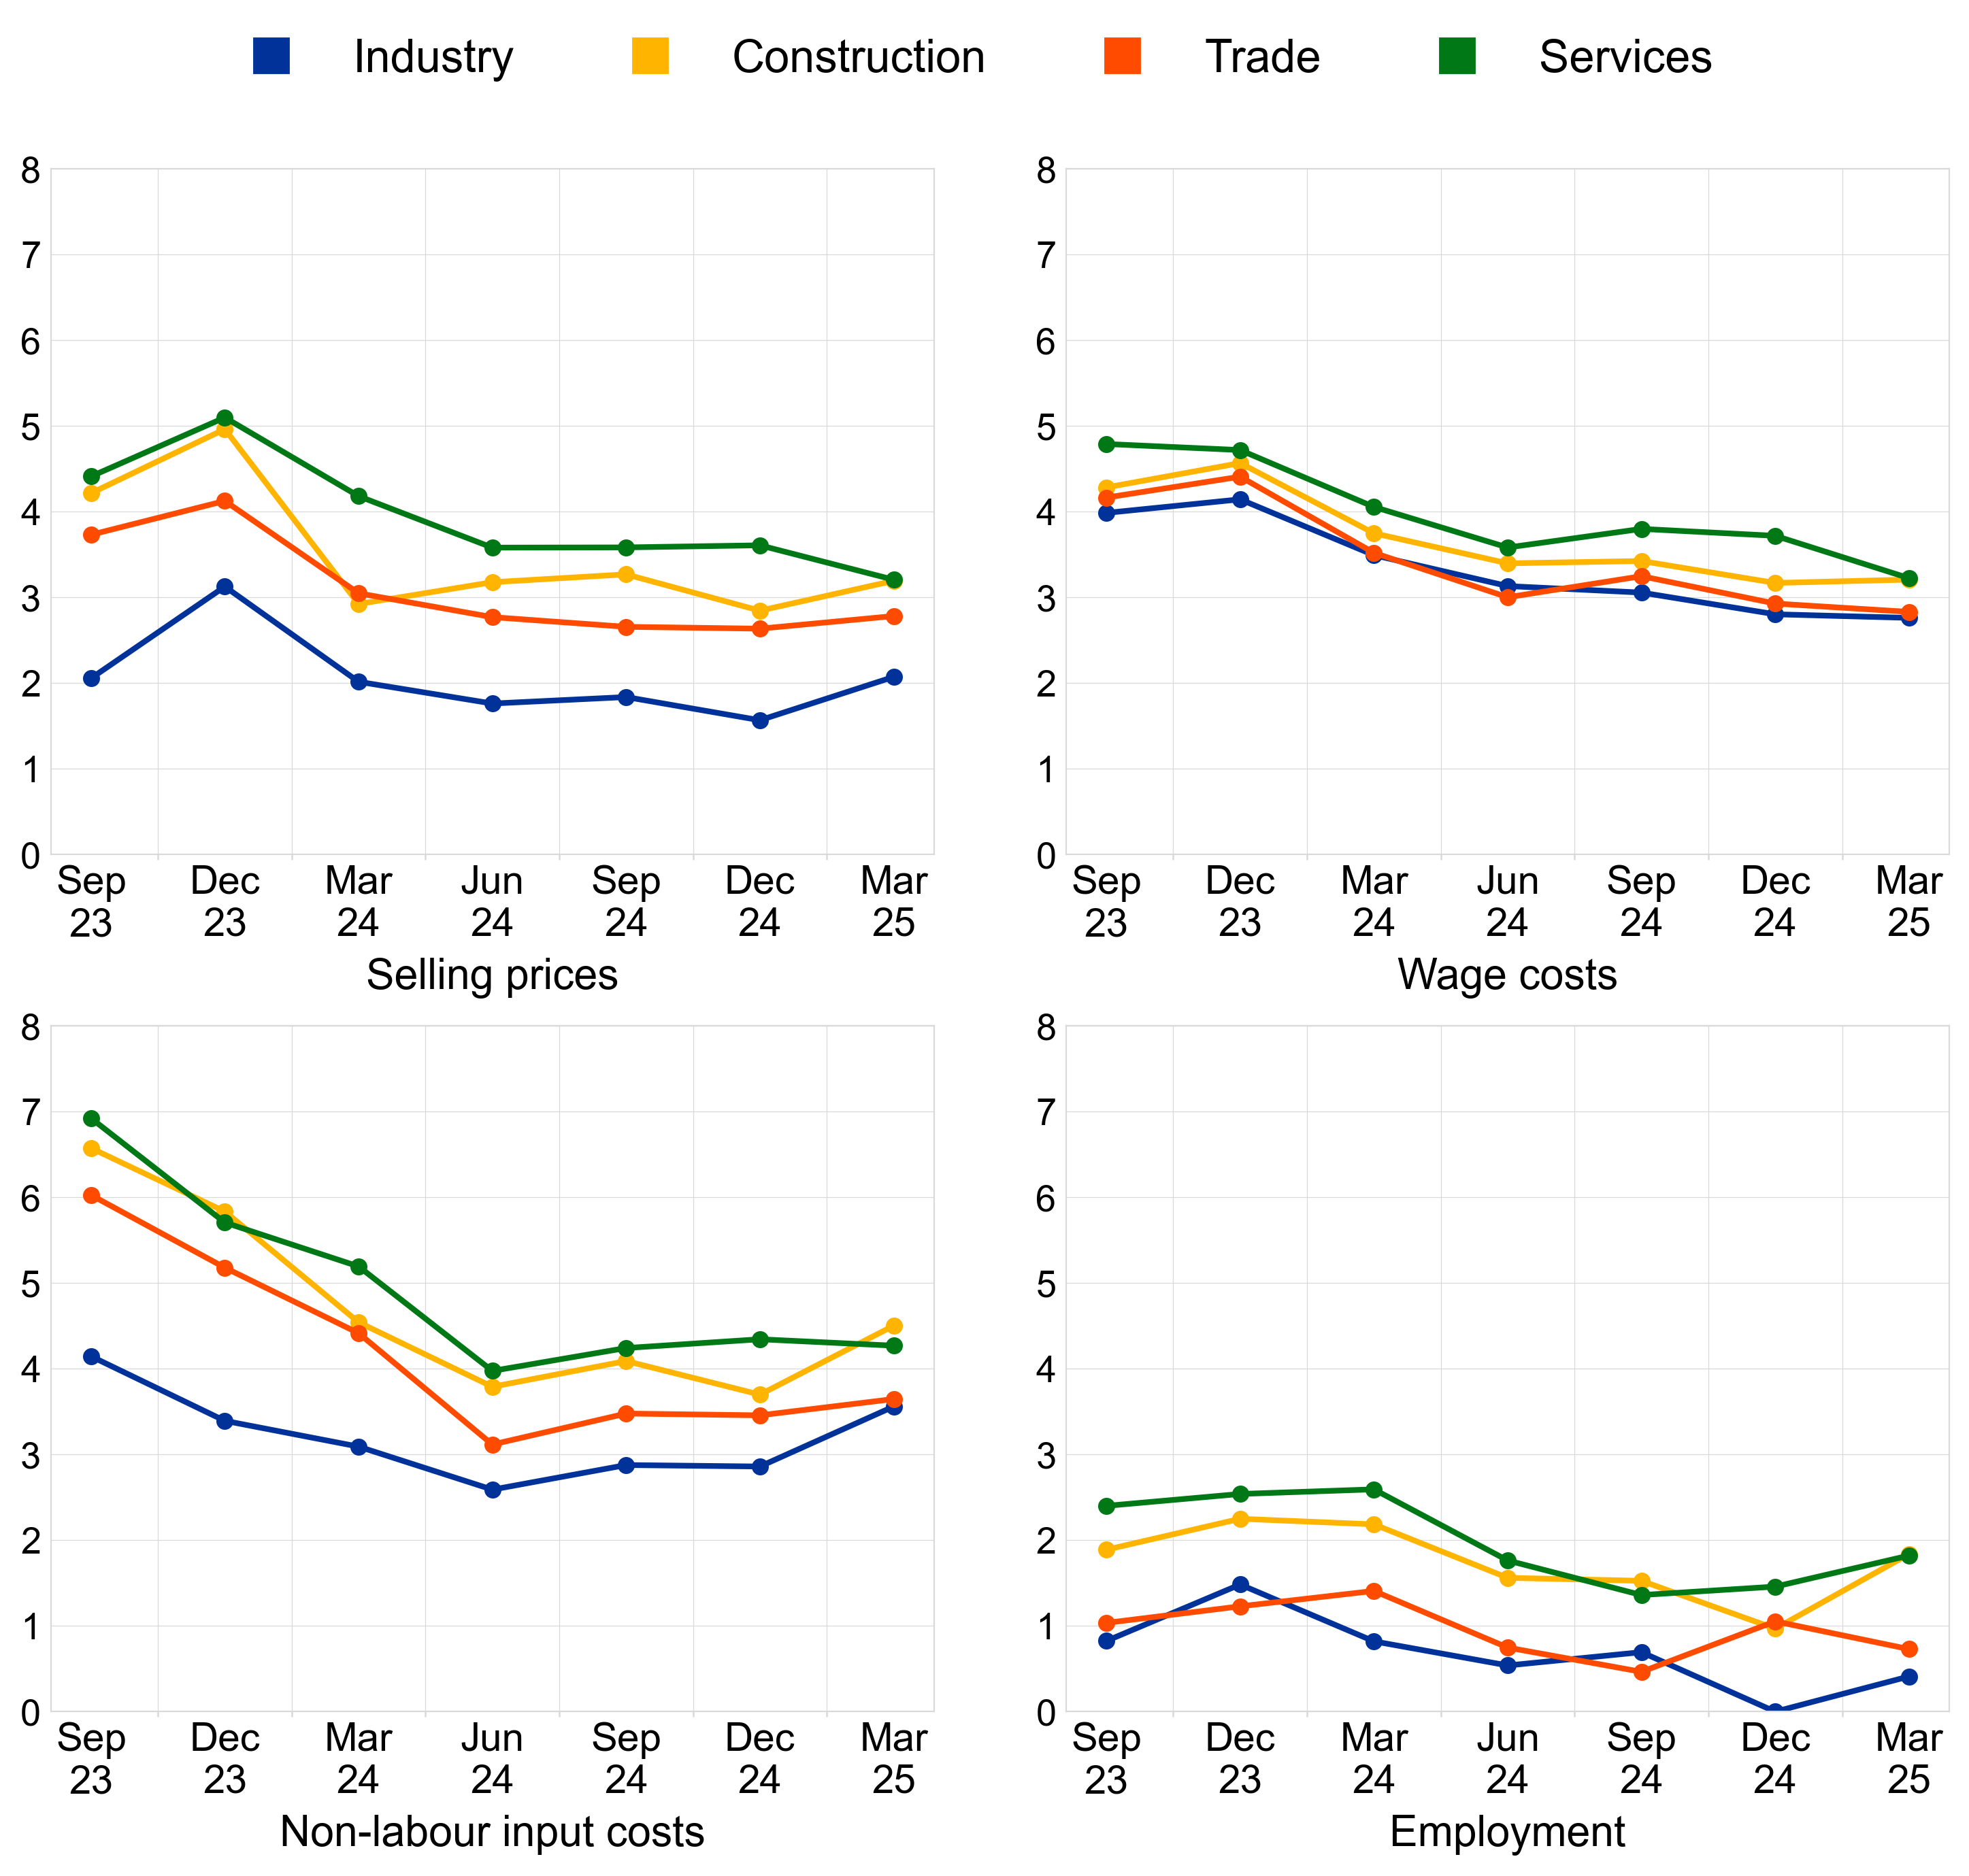
Comparing developments across sectors, firms in services continue to expect larger selling price increases than in trade and industry (Chart 17). Firms in the service sector expect their selling prices to rise by 3.2% (down from 3.6% in the previous survey round), as do firms in the construction sector (3.2%, up from 2.8% in the previous survey round) and higher than the average of 2.1% and 2.8% projected by the industry and trade sectors respectively (up from 1.6% and 2.6% in the previous survey round). Wage cost expectations in services have declined to 3.2%, down from 3.7% in previous survey round, in line with expectations in the construction sector, which remained stable at 3.2%. Wage growth for firms in the industry and trade sectors stood at 2.8%. The services sector continues to report an expected increase of 4.3% in non-labour input costs, while the construction and the industry sectors anticipate increases of 4.5% and 3.6% respectively, up from 3.7% and 2.9% in the previous survey round. The trade sector reports a 3.6% increase, slightly up from 3.5% in the previous survey round. In terms of employment growth, expected increases were larger in the services and construction sectors (1.8%), while they were more modest in industry (0.4%) and trade (0.7%).
Chart 17
Average expectations for selling prices, wages and input costs one year ahead, by sector
(percentage changes over the next 12 months)
Base: All firms. The figures refer to rounds 29 to 34 (September 2023 to March 2025) of the survey, with firms’ replies collected in the last month of the respective survey waves.
Notes: Mean euro area firm expectations of changes in selling prices, wages of current employees, non-labour input costs and number of employees for the next 12 months, along with interquartile ranges, using survey weights. The statistics are computed after trimming the data at the country-specific 1st and 99th percentiles. The data included in the chart refer to Question 34 of the survey.
3.5 Firms’ inflation expectations remained broadly unchanged
Euro area firms’ median inflation expectations decreased slightly to 2.9%, from 3%, for the one-year horizon and remained at 3.0% for the three and five-year horizons (Chart 18). Across size classes, large firms decrease their median one-year-ahead inflation expectations to 2.7%, down from 2.9% in the previous survey round, while SMEs continue reporting 3.0% (Chart 19). While for the three-year horizon there was almost no revision of expectations for both SMEs (stable at 3.1%) and large firms (down to 2.5%, from 2.6% in the previous survey round), there was divergence across size classes for the five-year horizon. SME expect inflation of 3.8%, up from 3.1% in the previous survey round, mostly driven by SMEs in services. At the same time, large firms expect inflation of 2.5%, down from 2.7% in December.
Inflation expectations for the one- and three-year horizon remained mostly unchanged across sectors. For the five-year horizon, they have increased since previous survey round from 3.5% to 3.6% for the construction sector and from 3.0% to 3.1% for services, while they have decreased from 2.9% to 2.8% for the industry sector and remained at 3.0% for the trade sector.
Chart 18
Firms’ expectations for euro area inflation at different horizons
(annual percentages)
Base: All firms. The figures refer to pilot 2 and rounds 30 to 34 of the survey (December 2023 to March 2025).
Notes: Survey-weighted median, mode and interquartile ranges of firms’ expectations for euro area inflation in one year, three years and five years. Quantiles are computed by linear interpolation of the mid-distribution function. The statistics are computed after trimming the data at the country-specific 1st and 99th percentiles. The data included in the chart refer to Question 31 of the survey.
Chart 19
Firms’ median expectations for euro area inflation by size class
(annual percentages)

Base: All firms. The figures refer to pilot 2 and rounds 30 to 34 (December 2023 to March 2025) of the survey, with firms’ replies collected in the last month of the respective survey waves.
Notes: Survey-weighted median of euro area firms’ expectations for euro area inflation in one year, three years and five years. The statistics are computed after trimming the data at the country-specific 1st and 99th percentiles. The data included in the chart refer to Question 31 of the survey.
Fewer firms reported that risks to the five-year-ahead inflation outlook are broadly balanced, while more firms perceived these risks as being tilted to the upside (Chart 20). In total, 30% of firms perceived the risks to their inflation outlook over the next five years as being broadly balanced (down from 33% in the previous survey round). The proportion of firms seeing upside risk increased (55%, up from 51% in the previous survey round), mirrored by a decrease in the proportion of those seeing risks to be to the downside (14%, down from 16% in the previous survey round). For both large firms and SMEs, risks remain clearly tilted to the upside, with the same proportion of SMEs and large firms reporting upside risks (55% for both, up from 54% and 45% respectively in the previous round).
Chart 20
Firms’ perceived risks for euro area inflation five years ahead, by firm size
(weighted percentages)
Base: All firms. The figures refer to rounds 30 to 34 (March 2024 to March 2025) of the survey.
Notes: Survey-weighted percentages of firms’ subjective inflation outlook over the next five years. The statistics are computed after trimming firms replying to Question 31 on the five-year ahead scenario at the country-specific 1st and 99th percentiles and does not consider firms that answered “don’t know” in Question 31 on the five-year ahead scenario. The data included in the chart refer to Question 33 of the survey.
4.1 Annex 1
Descriptive statistics for the sample of firms
Chart 21
Breakdown of firms by economic activity
(unweighted percentages)
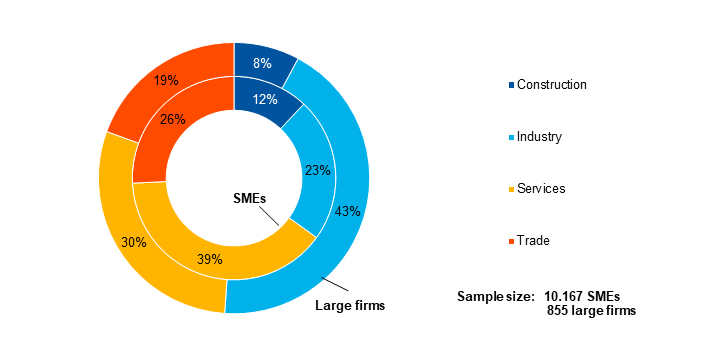
Base: The figures refer to round 34 of the survey (January-March 2025).
Chart 22
Breakdown of firms by age
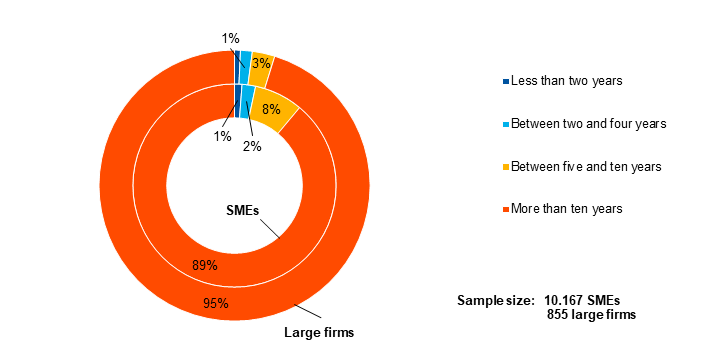
Base: The figures refer to round 34 of the survey (January-March 2025).
Chart 23
Breakdown of firms by ownership
(unweighted percentages)
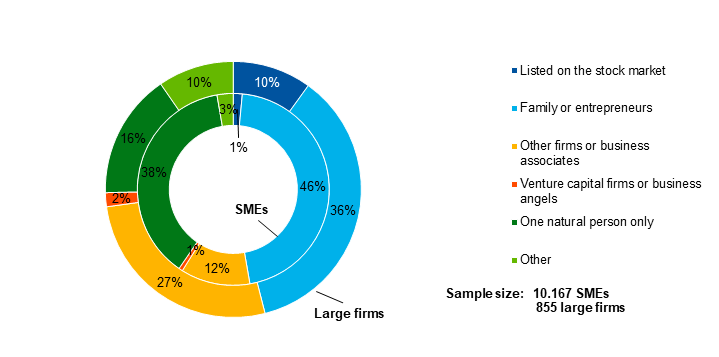
Base: The figures refer to round 34 of the survey (January-March 2025).
Chart 24
Breakdown of firms by exports
(unweighted percentages)
Base: The figures refer to round 34 of the survey (January-March 2025).
4.2 Annex 2
Methodological information on the survey
For an overview of how the survey was set up, the general characteristics of the euro area firms that participate in the survey and the changes introduced to the methodology and the questionnaire over time, see the “Methodological information on the survey and user guide for the anonymised micro dataset”, which is available on the ECB’s website.[6]
In this round, both the six-monthly reference periods and the three-monthly reference periods were covered.
Questions Q0b, Q32 and Q6A were re-introduced, but asked only to the six-monthly reference period sample group.
All items which were removed in the fourth quarter of 2024 wave from questions Q4, Q5, Q7A, Q7B, Q11, Q9 and Q23 were re-introduced for the six-monthly reference period sample group.
There were no ad hoc questions asked in this round.
© European Central Bank, 2025
Postal address 60640 Frankfurt am Main, Germany
Telephone +49 69 1344 0
Website www.ecb.europa.eu
All rights reserved. Reproduction for educational and non-commercial purposes is permitted provided that the source is acknowledged.
For specific terminology please refer to the ECB glossary (available in English only).
PDF ISSN 1831-9998, QB-AP-24-129-EN-N
HTML ISSN 1831-9998, QB-AP-24-129-EN-Q
Distribution channels: Banking, Finance & Investment Industry
Legal Disclaimer:
EIN Presswire provides this news content "as is" without warranty of any kind. We do not accept any responsibility or liability for the accuracy, content, images, videos, licenses, completeness, legality, or reliability of the information contained in this article. If you have any complaints or copyright issues related to this article, kindly contact the author above.
Submit your press release